| Red | Green | Blue | |
| z | 17.64 | ||
| znorm | Inf | ||
| sky | -NaN | -Inf | -Inf |
| S/N | 25.8 | 46.6 | 49.0 |
| S/N(c) | 0.0 | 0.0 | 0.0 |
| SN(E/C) |
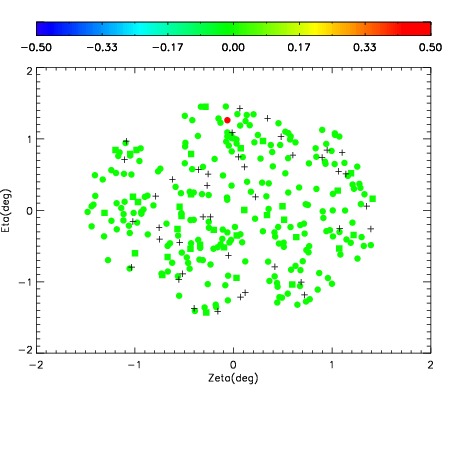

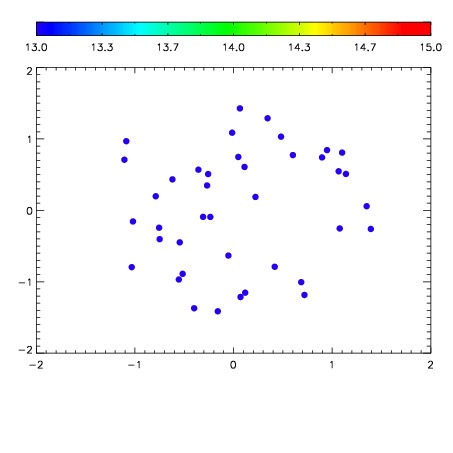

| Frame | Nreads | Zeropoints | Mag plots | Spatial mag deviation | Spatial sky 16325A emission deviations (filled: sky, open: star) | Spatial sky continuum emission | Spatial sky telluric CO2 absorption deviations (filled: H < 10) | |||||||||||||||||||||||
| 0 | 0 |
|
|
|
|
|
|
| IPAIR | NAME | SHIFT | NEWSHIFT | S/N | NAME | SHIFT | NEWSHIFT | S/N |
| 0 | 06610048 | 0.483733 | 0.00000 | 212.195 | 06610047 | 0.00000 | 0.483733 | 213.347 |
| 1 | 06610053 | 0.482277 | 0.00145599 | 213.121 | 06610054 | -0.000600854 | 0.484334 | 214.324 |
| 2 | 06610052 | 0.481676 | 0.00205699 | 211.996 | 06610051 | -0.00113491 | 0.484868 | 209.257 |
| 3 | 06610049 | 0.483692 | 4.10080e-05 | 210.108 | 06610050 | 0.000420599 | 0.483312 | 208.411 |