| Red | Green | Blue | |
| z | 17.64 | ||
| znorm | Inf | ||
| sky | -Inf | -Inf | -Inf |
| S/N | 26.1 | 46.7 | 50.6 |
| S/N(c) | 0.0 | 0.0 | 0.0 |
| SN(E/C) |
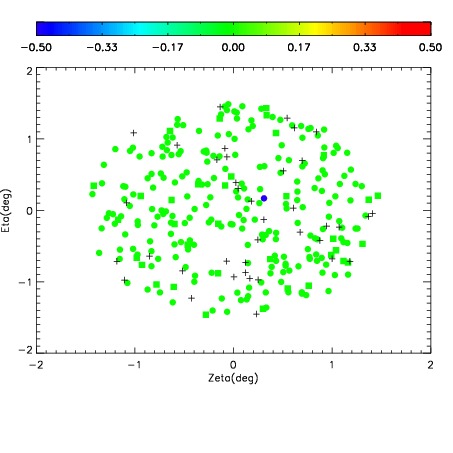
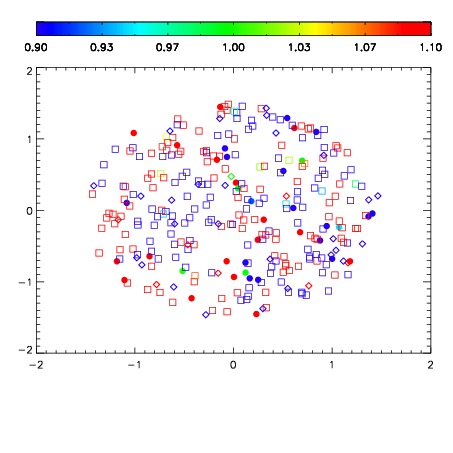
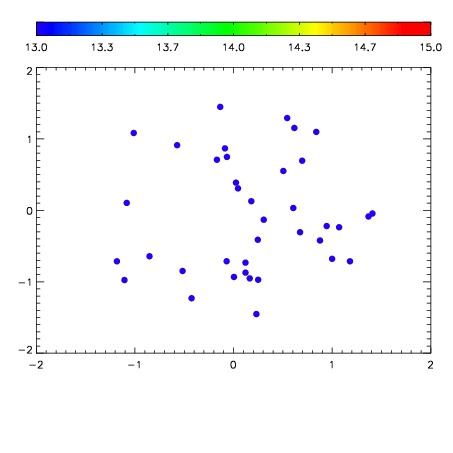

| Frame | Nreads | Zeropoints | Mag plots | Spatial mag deviation | Spatial sky 16325A emission deviations (filled: sky, open: star) | Spatial sky continuum emission | Spatial sky telluric CO2 absorption deviations (filled: H < 10) | |||||||||||||||||||||||
| 0 | 0 |
|
|
|
|
|
|
| IPAIR | NAME | SHIFT | NEWSHIFT | S/N | NAME | SHIFT | NEWSHIFT | S/N |
| 0 | 06070063 | 0.479465 | 0.00000 | 181.342 | 06070065 | -0.00166105 | 0.481126 | 183.724 |
| 1 | 06070064 | 0.479416 | 4.89950e-05 | 185.378 | 06070062 | 0.000429111 | 0.479036 | 185.879 |
| 2 | 06070060 | 0.478075 | 0.00139001 | 182.558 | 06070061 | -0.00178948 | 0.481254 | 185.761 |
| 3 | 06070059 | 0.478027 | 0.00143802 | 180.053 | 06070058 | 0.00000 | 0.479465 | 177.653 |