| Red | Green | Blue | |
| z | 17.64 | ||
| znorm | Inf | ||
| sky | -Inf | -Inf | -Inf |
| S/N | 20.5 | 37.8 | 42.4 |
| S/N(c) | 0.0 | 0.0 | 0.0 |
| SN(E/C) |
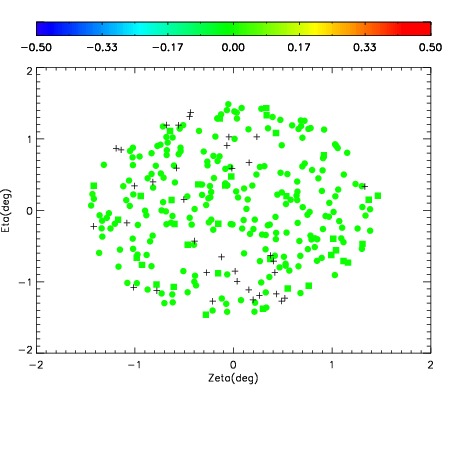
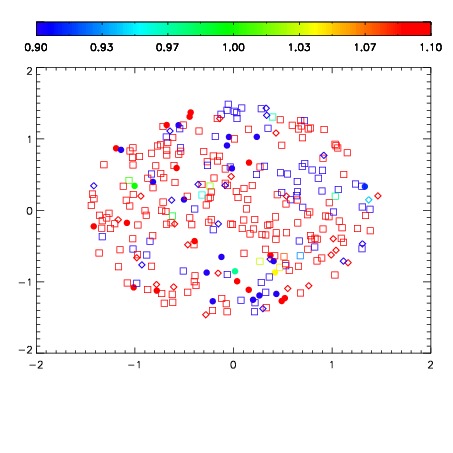
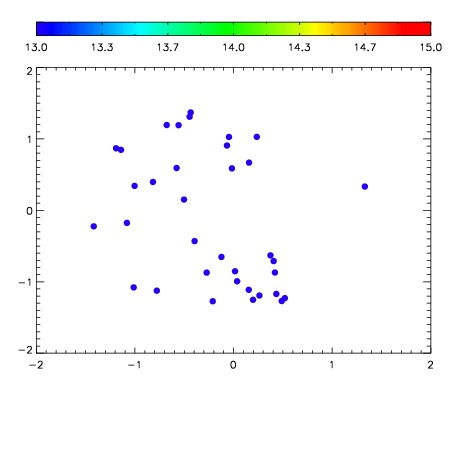

| Frame | Nreads | Zeropoints | Mag plots | Spatial mag deviation | Spatial sky 16325A emission deviations (filled: sky, open: star) | Spatial sky continuum emission | Spatial sky telluric CO2 absorption deviations (filled: H < 10) | |||||||||||||||||||||||
| 0 | 0 |
|
|
|
|
|
|
| IPAIR | NAME | SHIFT | NEWSHIFT | S/N | NAME | SHIFT | NEWSHIFT | S/N |
| 0 | 06080059 | 0.484128 | 0.00000 | 146.119 | 06080065 | -0.00522821 | 0.489356 | 149.760 |
| 1 | 06080060 | 0.482889 | 0.00123900 | 138.979 | 06080058 | 0.00000 | 0.484128 | 146.430 |
| 2 | 06080064 | 0.479816 | 0.00431201 | 138.444 | 06080062 | -0.00548743 | 0.489615 | 139.003 |
| 3 | 06080063 | 0.479880 | 0.00424799 | 120.749 | 06080061 | -0.00349325 | 0.487621 | 136.286 |