| Red | Green | Blue | |
| z | 17.64 | ||
| znorm | Inf | ||
| sky | -Inf | -Inf | -Inf |
| S/N | 35.3 | 56.5 | 60.1 |
| S/N(c) | 0.0 | 0.0 | 0.0 |
| SN(E/C) |
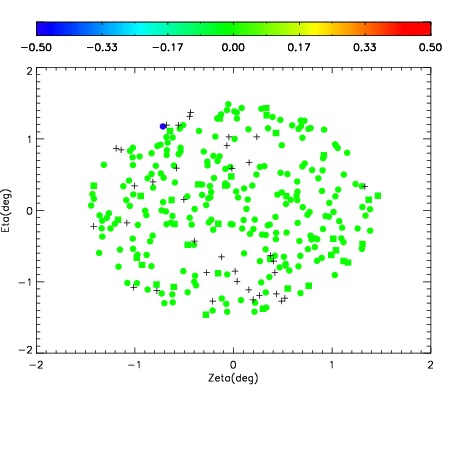
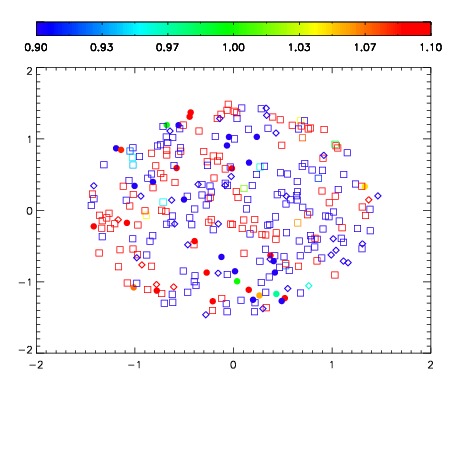
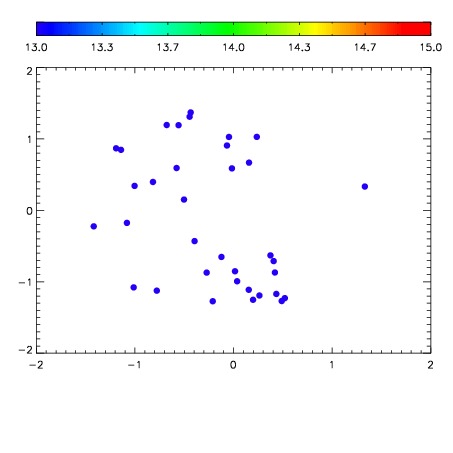

| Frame | Nreads | Zeropoints | Mag plots | Spatial mag deviation | Spatial sky 16325A emission deviations (filled: sky, open: star) | Spatial sky continuum emission | Spatial sky telluric CO2 absorption deviations (filled: H < 10) | |||||||||||||||||||||||
| 0 | 0 |
|
|
|
|
|
|
| IPAIR | NAME | SHIFT | NEWSHIFT | S/N | NAME | SHIFT | NEWSHIFT | S/N |
| 0 | 06130017 | 0.485558 | 0.00000 | 183.536 | 06130018 | -0.00214514 | 0.487703 | 180.684 |
| 1 | 06130013 | 0.484259 | 0.00129899 | 195.271 | 06130014 | 0.00165301 | 0.483905 | 193.994 |
| 2 | 06130012 | 0.483813 | 0.00174502 | 191.685 | 06130011 | 0.00000 | 0.485558 | 188.773 |
| 3 | 06130016 | 0.484086 | 0.00147200 | 186.137 | 06130015 | 6.27630e-05 | 0.485495 | 186.809 |