| Red | Green | Blue | |
| z | 17.64 | ||
| znorm | Inf | ||
| sky | -Inf | -Inf | -Inf |
| S/N | 31.9 | 53.2 | 58.9 |
| S/N(c) | 0.0 | 0.0 | 0.0 |
| SN(E/C) |

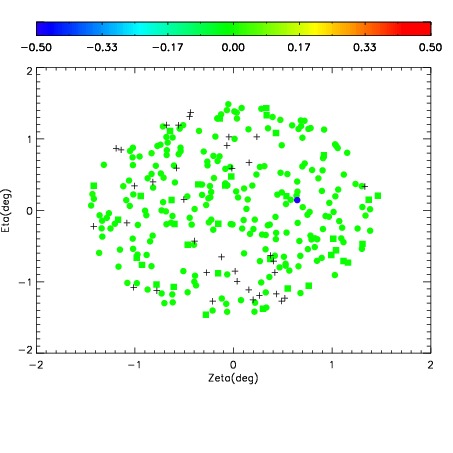
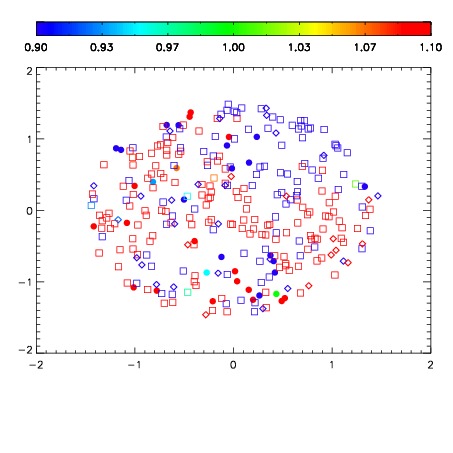
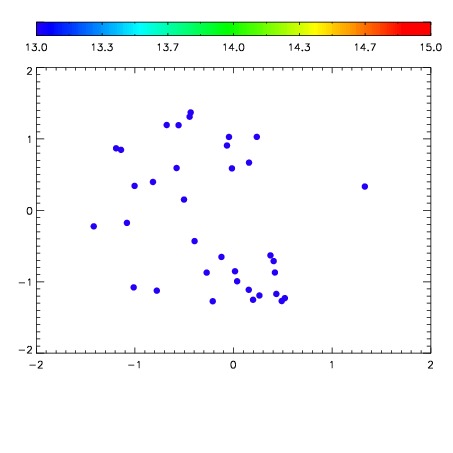

| Frame | Nreads | Zeropoints | Mag plots | Spatial mag deviation | Spatial sky 16325A emission deviations (filled: sky, open: star) | Spatial sky continuum emission | Spatial sky telluric CO2 absorption deviations (filled: H < 10) | |||||||||||||||||||||||
| 0 | 0 |
|
|
|
|
|
|
| IPAIR | NAME | SHIFT | NEWSHIFT | S/N | NAME | SHIFT | NEWSHIFT | S/N |
| 0 | 06380027 | 0.475560 | 0.00000 | 146.135 | 06380026 | 0.00000 | 0.475560 | 148.146 |
| 1 | 06380035 | 0.474107 | 0.00145301 | 165.454 | 06380037 | 0.000970922 | 0.474589 | 173.072 |
| 2 | 06380036 | 0.474201 | 0.00135902 | 165.417 | 06380034 | 0.0134268 | 0.462133 | 158.785 |
| 3 | 06380032 | 0.475419 | 0.000140995 | 147.813 | 06380033 | -0.000204910 | 0.475765 | 150.505 |
| 4 | 06380031 | 0.474955 | 0.000605017 | 104.740 | 06380030 | -0.00333367 | 0.478894 | 65.2745 |
| 5 | 06380028 | 0.472895 | 0.00266501 | 39.6086 | 06380029 | -0.00227412 | 0.477834 | 58.6336 |