| Red | Green | Blue | |
| z | 17.64 | ||
| znorm | Inf | ||
| sky | -Inf | -Inf | -Inf |
| S/N | 14.3 | 26.0 | 31.4 |
| S/N(c) | 0.0 | 0.0 | 0.0 |
| SN(E/C) |
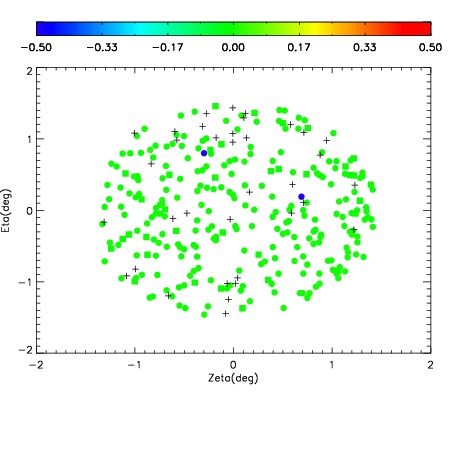
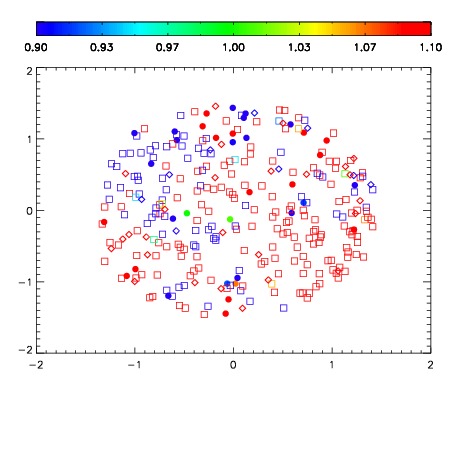
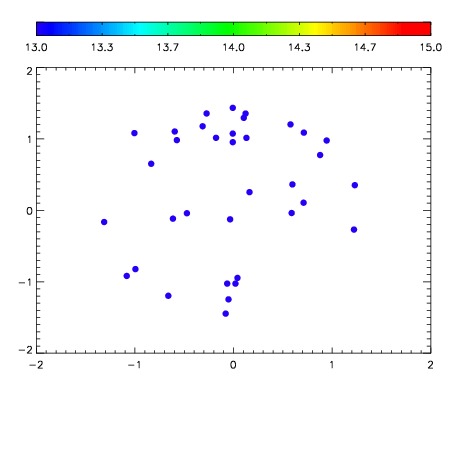

| Frame | Nreads | Zeropoints | Mag plots | Spatial mag deviation | Spatial sky 16325A emission deviations (filled: sky, open: star) | Spatial sky continuum emission | Spatial sky telluric CO2 absorption deviations (filled: H < 10) | |||||||||||||||||||||||
| 0 | 0 |
|
|
|
|
|
|
| IPAIR | NAME | SHIFT | NEWSHIFT | S/N | NAME | SHIFT | NEWSHIFT | S/N |
| 0 | 06620034 | 0.481220 | 0.00000 | 168.913 | 06620035 | 0.00143969 | 0.479780 | 149.615 |
| 1 | 06620033 | 0.480503 | 0.000717014 | 187.994 | 06620032 | 0.00000 | 0.481220 | 179.459 |
| 2 | 06620037 | 0.476859 | 0.00436100 | 137.378 | 06620039 | 0.000405123 | 0.480815 | 147.231 |
| 3 | 06620038 | 0.477598 | 0.00362200 | 83.0613 | 06620036 | 0.00526792 | 0.475952 | 55.1816 |