| Red | Green | Blue | |
| z | 17.64 | ||
| znorm | Inf | ||
| sky | -Inf | -Inf | -Inf |
| S/N | 28.8 | 44.6 | 52.0 |
| S/N(c) | 0.0 | 0.0 | 0.0 |
| SN(E/C) |


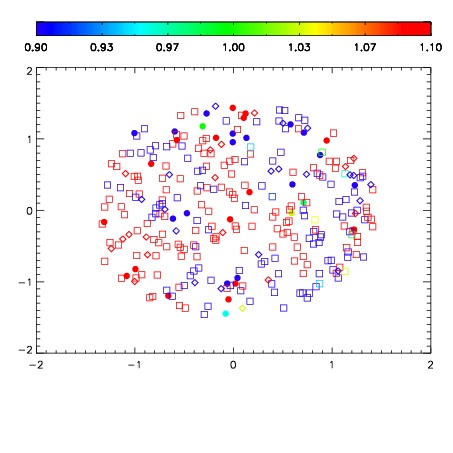
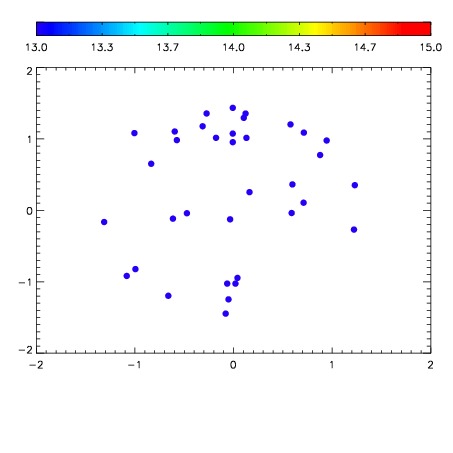

| Frame | Nreads | Zeropoints | Mag plots | Spatial mag deviation | Spatial sky 16325A emission deviations (filled: sky, open: star) | Spatial sky continuum emission | Spatial sky telluric CO2 absorption deviations (filled: H < 10) | |||||||||||||||||||||||
| 0 | 0 |
|
|
|
|
|
|
| IPAIR | NAME | SHIFT | NEWSHIFT | S/N | NAME | SHIFT | NEWSHIFT | S/N |
| 0 | 06950012 | 0.492312 | 0.00000 | 209.869 | 06950013 | 0.00330384 | 0.489008 | 208.156 |
| 1 | 06950015 | 0.491351 | 0.000961006 | 211.050 | 06950014 | 0.00270415 | 0.489608 | 209.140 |
| 2 | 06950016 | 0.491870 | 0.000442028 | 209.002 | 06950010 | 0.00000 | 0.492312 | 206.356 |
| 3 | 06950011 | 0.491486 | 0.000826001 | 206.668 | 06950017 | 0.00545941 | 0.486853 | 204.222 |