| Red | Green | Blue | |
| z | 17.64 | ||
| znorm | Inf | ||
| sky | -Inf | -Inf | -Inf |
| S/N | 21.8 | 40.3 | 42.7 |
| S/N(c) | 0.0 | 0.0 | 0.0 |
| SN(E/C) |
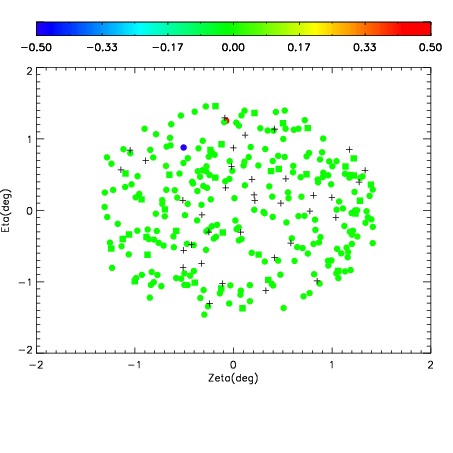
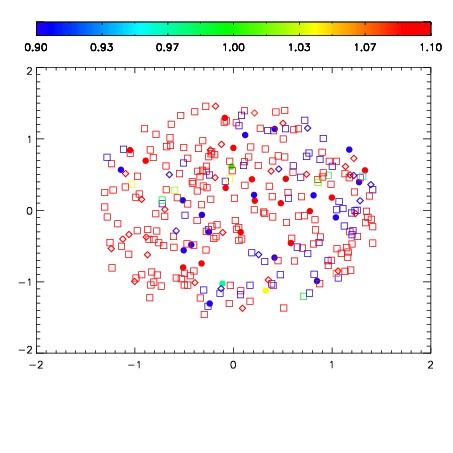
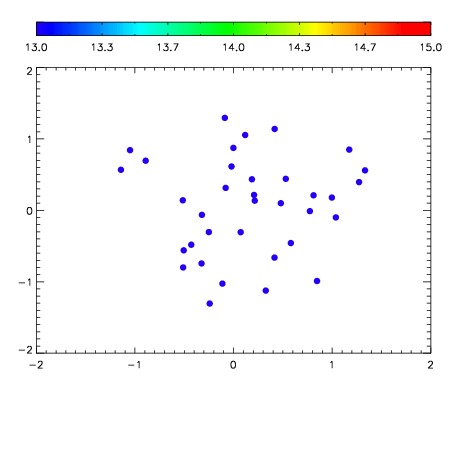

| Frame | Nreads | Zeropoints | Mag plots | Spatial mag deviation | Spatial sky 16325A emission deviations (filled: sky, open: star) | Spatial sky continuum emission | Spatial sky telluric CO2 absorption deviations (filled: H < 10) | |||||||||||||||||||||||
| 0 | 0 |
|
|
|
|
|
|
| IPAIR | NAME | SHIFT | NEWSHIFT | S/N | NAME | SHIFT | NEWSHIFT | S/N |
| 0 | 06720012 | 0.482655 | 0.00000 | 201.459 | 06720014 | 0.00109768 | 0.481557 | 186.318 |
| 1 | 06720015 | 0.479511 | 0.00314400 | 206.345 | 06720013 | 0.00131693 | 0.481338 | 205.058 |
| 2 | 06720016 | 0.481335 | 0.00131997 | 196.266 | 06720010 | 0.00000 | 0.482655 | 177.931 |
| 3 | 06720011 | 0.480196 | 0.00245899 | 176.169 | 06720017 | 0.00157454 | 0.481080 | 174.848 |