| Red | Green | Blue | |
| z | 17.64 | ||
| znorm | Inf | ||
| sky | -Inf | -Inf | -Inf |
| S/N | 20.9 | 37.6 | 38.3 |
| S/N(c) | 0.0 | 0.0 | 0.0 |
| SN(E/C) |

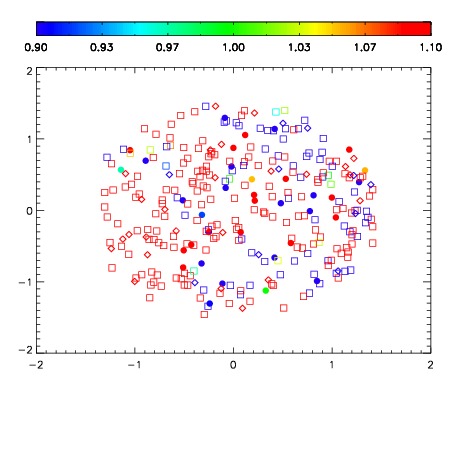


| Frame | Nreads | Zeropoints | Mag plots | Spatial mag deviation | Spatial sky 16325A emission deviations (filled: sky, open: star) | Spatial sky continuum emission | Spatial sky telluric CO2 absorption deviations (filled: H < 10) | |||||||||||||||||||||||
| 0 | 0 |
|
|
|
|
|
|
| IPAIR | NAME | SHIFT | NEWSHIFT | S/N | NAME | SHIFT | NEWSHIFT | S/N |
| 0 | 06960016 | 0.496432 | 0.00000 | 190.795 | 06960015 | -0.00277610 | 0.499208 | 194.680 |
| 1 | 06960012 | 0.495163 | 0.00126901 | 206.679 | 06960011 | 0.00000 | 0.496432 | 204.106 |
| 2 | 06960013 | 0.494468 | 0.00196400 | 200.193 | 06960014 | -0.00276351 | 0.499196 | 203.607 |
| 3 | 06960017 | 0.496332 | 0.000100017 | 175.794 | 06960018 | 0.000840220 | 0.495592 | 148.943 |