| Red | Green | Blue | |
| z | 17.64 | ||
| znorm | Inf | ||
| sky | -Inf | -Inf | -Inf |
| S/N | 26.7 | 45.2 | 47.5 |
| S/N(c) | 0.0 | 0.0 | 0.0 |
| SN(E/C) |
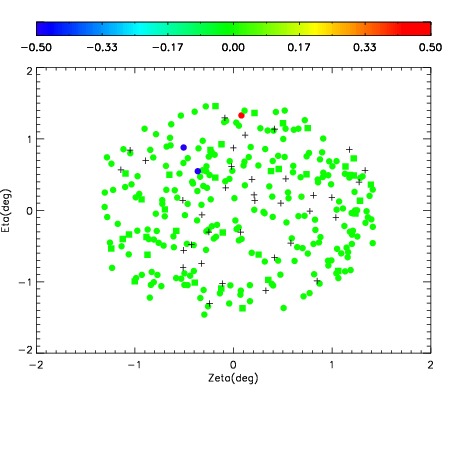
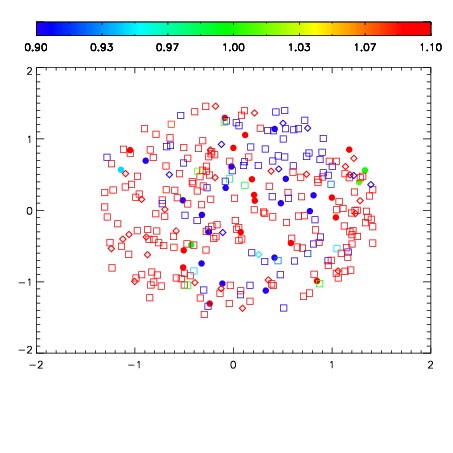
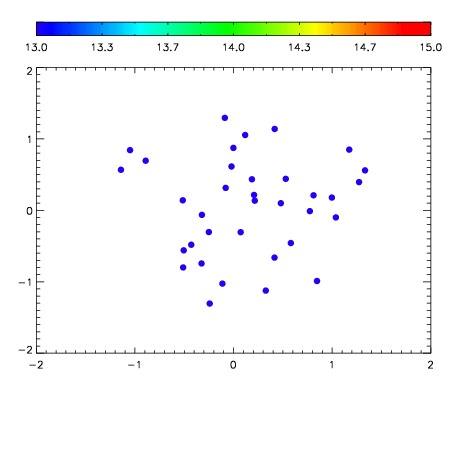

| Frame | Nreads | Zeropoints | Mag plots | Spatial mag deviation | Spatial sky 16325A emission deviations (filled: sky, open: star) | Spatial sky continuum emission | Spatial sky telluric CO2 absorption deviations (filled: H < 10) | |||||||||||||||||||||||
| 0 | 0 |
|
|
|
|
|
|
| IPAIR | NAME | SHIFT | NEWSHIFT | S/N | NAME | SHIFT | NEWSHIFT | S/N |
| 0 | 07000013 | 0.479701 | 0.00000 | 209.304 | 07000011 | 0.00000 | 0.479701 | 207.083 |
| 1 | 07000017 | 0.478483 | 0.00121802 | 209.618 | 07000018 | -0.000951106 | 0.480652 | 219.220 |
| 2 | 07000016 | 0.475554 | 0.00414702 | 209.525 | 07000015 | -0.00455232 | 0.484253 | 211.423 |
| 3 | 07000012 | 0.478374 | 0.00132701 | 208.286 | 07000014 | -0.00283913 | 0.482540 | 205.351 |