| Red | Green | Blue | |
| z | 17.64 | ||
| znorm | Inf | ||
| sky | -Inf | -Inf | -Inf |
| S/N | 27.6 | 48.1 | 52.0 |
| S/N(c) | 0.0 | 0.0 | 0.0 |
| SN(E/C) |
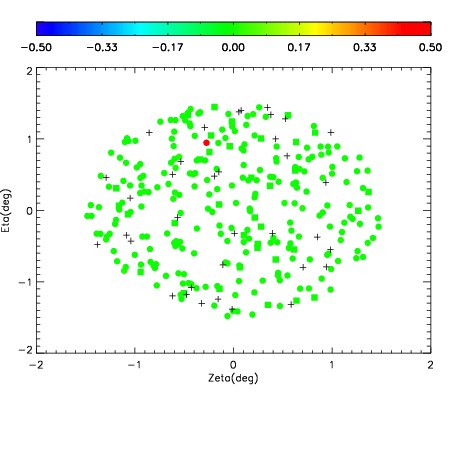
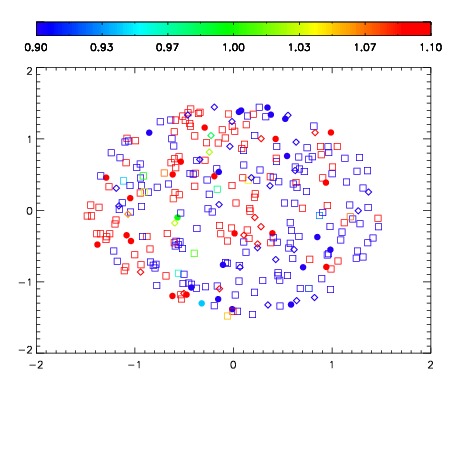
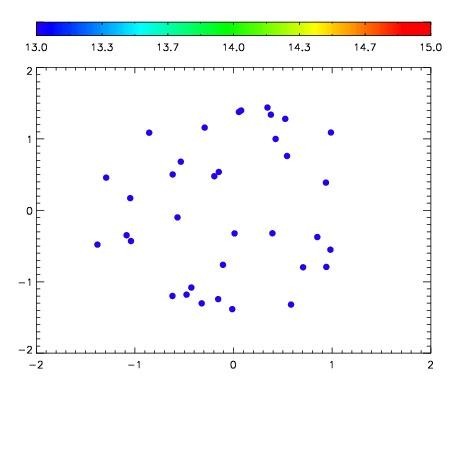

| Frame | Nreads | Zeropoints | Mag plots | Spatial mag deviation | Spatial sky 16325A emission deviations (filled: sky, open: star) | Spatial sky continuum emission | Spatial sky telluric CO2 absorption deviations (filled: H < 10) | |||||||||||||||||||||||
| 0 | 0 |
|
|
|
|
|
|
| IPAIR | NAME | SHIFT | NEWSHIFT | S/N | NAME | SHIFT | NEWSHIFT | S/N |
| 0 | 06440028 | 0.469247 | 0.00000 | 237.976 | 06440026 | 0.00000 | 0.469247 | 235.158 |
| 1 | 06440032 | 0.467714 | 0.00153300 | 244.553 | 06440033 | -0.00229244 | 0.471539 | 250.510 |
| 2 | 06440031 | 0.466541 | 0.00270602 | 241.689 | 06440030 | -0.00569202 | 0.474939 | 239.615 |
| 3 | 06440027 | 0.468661 | 0.000586003 | 238.720 | 06440029 | -0.00490845 | 0.474155 | 236.700 |