| Red | Green | Blue | |
| z | 17.64 | ||
| znorm | Inf | ||
| sky | -Inf | -NaN | -Inf |
| S/N | 26.9 | 51.3 | 56.5 |
| S/N(c) | 0.0 | 0.0 | 0.0 |
| SN(E/C) |
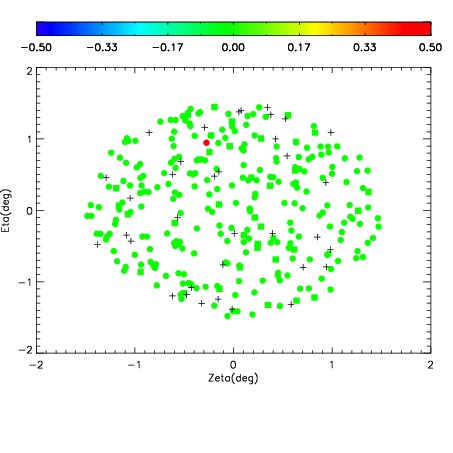
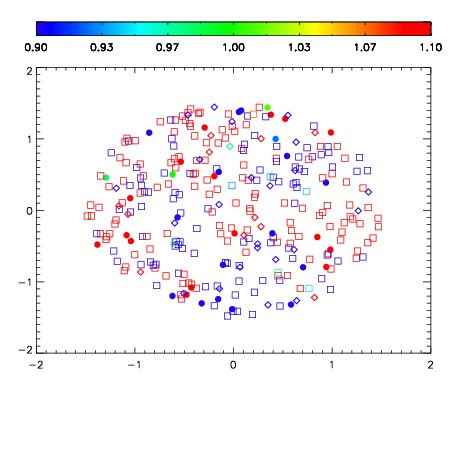
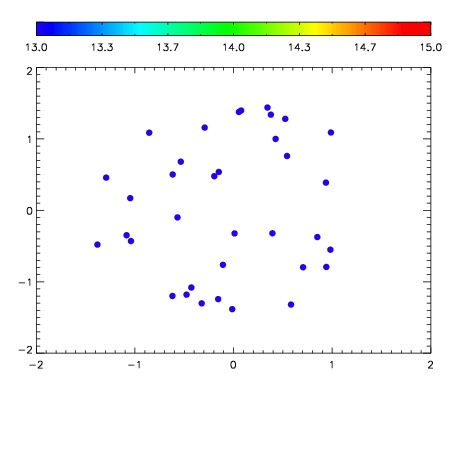

| Frame | Nreads | Zeropoints | Mag plots | Spatial mag deviation | Spatial sky 16325A emission deviations (filled: sky, open: star) | Spatial sky continuum emission | Spatial sky telluric CO2 absorption deviations (filled: H < 10) | |||||||||||||||||||||||
| 0 | 0 |
|
|
|
|
|
|
| IPAIR | NAME | SHIFT | NEWSHIFT | S/N | NAME | SHIFT | NEWSHIFT | S/N |
| 0 | 06630032 | 0.477995 | 0.00000 | 223.083 | 06630037 | -0.000233026 | 0.478228 | 232.310 |
| 1 | 06630040 | 0.475114 | 0.00288102 | 230.248 | 06630041 | -0.00310377 | 0.481099 | 235.543 |
| 2 | 06630036 | 0.475189 | 0.00280601 | 228.080 | 06630038 | -0.00202600 | 0.480021 | 232.991 |
| 3 | 06630039 | 0.475061 | 0.00293401 | 222.355 | 06630033 | -0.000491218 | 0.478486 | 222.586 |
| 4 | 06630031 | 0.477214 | 0.000781000 | 222.009 | 06630034 | 0.000112739 | 0.477882 | 222.581 |
| 5 | 06630035 | 0.475835 | 0.00216001 | 210.540 | 06630030 | 0.00000 | 0.477995 | 216.552 |