| Red | Green | Blue | |
| z | 17.64 | ||
| znorm | Inf | ||
| sky | -Inf | -Inf | -Inf |
| S/N | 30.9 | 49.8 | 56.7 |
| S/N(c) | 0.0 | 0.0 | 0.0 |
| SN(E/C) |
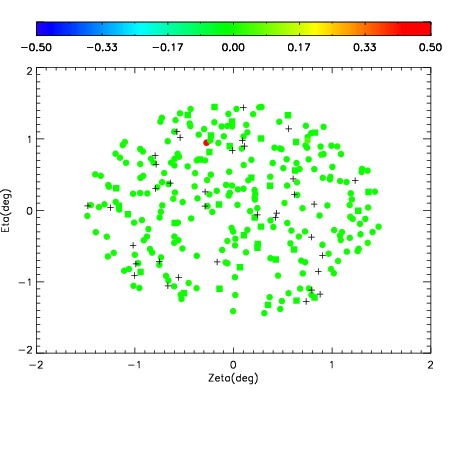
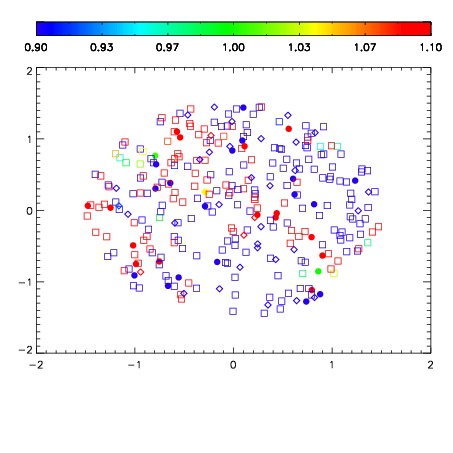


| Frame | Nreads | Zeropoints | Mag plots | Spatial mag deviation | Spatial sky 16325A emission deviations (filled: sky, open: star) | Spatial sky continuum emission | Spatial sky telluric CO2 absorption deviations (filled: H < 10) | |||||||||||||||||||||||
| 0 | 0 |
|
|
|
|
|
|
| IPAIR | NAME | SHIFT | NEWSHIFT | S/N | NAME | SHIFT | NEWSHIFT | S/N |
| 0 | 06680049 | 0.484989 | 0.00000 | 223.947 | 06680050 | 0.00282784 | 0.482161 | 231.126 |
| 1 | 06680045 | 0.484302 | 0.000686973 | 253.856 | 06680046 | -0.00100747 | 0.485996 | 260.194 |
| 2 | 06680048 | 0.484179 | 0.000809997 | 253.420 | 06680047 | -0.00126094 | 0.486250 | 256.838 |
| 3 | 06680044 | 0.484020 | 0.000968993 | 250.711 | 06680043 | 0.00000 | 0.484989 | 254.095 |