| Red | Green | Blue | |
| z | 17.64 | ||
| znorm | Inf | ||
| sky | -Inf | -Inf | -Inf |
| S/N | 33.3 | 55.4 | 68.0 |
| S/N(c) | 0.0 | 0.0 | 0.0 |
| SN(E/C) |
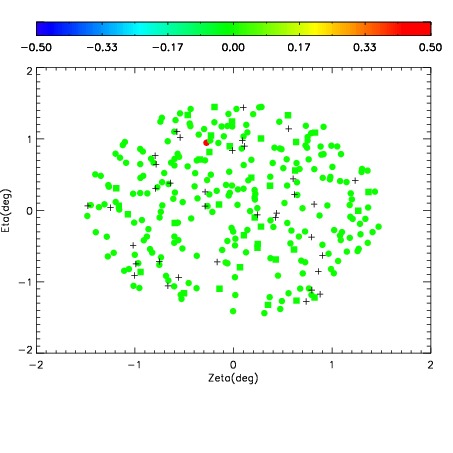
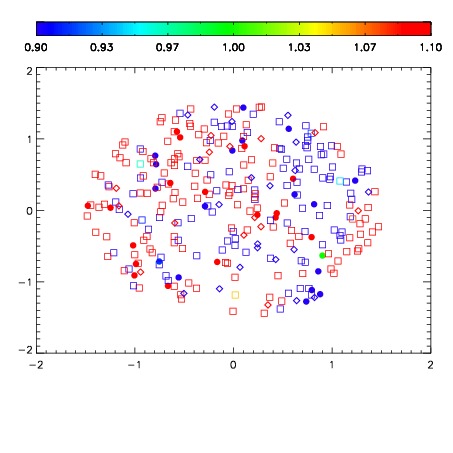
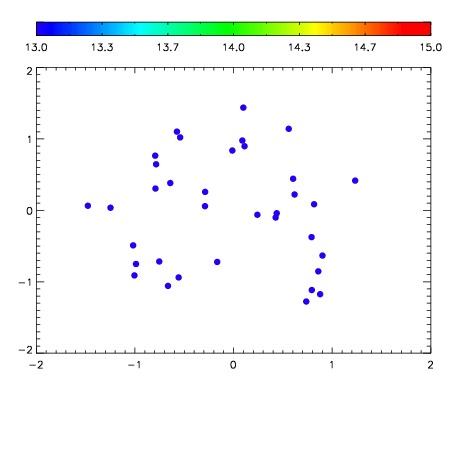

| Frame | Nreads | Zeropoints | Mag plots | Spatial mag deviation | Spatial sky 16325A emission deviations (filled: sky, open: star) | Spatial sky continuum emission | Spatial sky telluric CO2 absorption deviations (filled: H < 10) | |||||||||||||||||||||||
| 0 | 0 |
|
|
|
|
|
|
| IPAIR | NAME | SHIFT | NEWSHIFT | S/N | NAME | SHIFT | NEWSHIFT | S/N |
| 0 | 06920047 | 0.500183 | 0.00000 | 248.043 | 06920040 | 0.00400886 | 0.496174 | 247.554 |
| 1 | 06920046 | 0.499646 | 0.000536978 | 249.771 | 06920041 | 0.00154084 | 0.498642 | 247.701 |
| 2 | 06920042 | 0.497945 | 0.00223798 | 245.434 | 06920045 | -0.000334059 | 0.500517 | 247.058 |
| 3 | 06920043 | 0.497988 | 0.00219500 | 245.412 | 06920048 | 0.00381958 | 0.496363 | 245.800 |
| 4 | 06920039 | 0.498974 | 0.00120899 | 242.771 | 06920044 | 0.00347749 | 0.496706 | 245.589 |
| 5 | 06920038 | 0.498412 | 0.00177097 | 241.511 | 06920037 | 0.00000 | 0.500183 | 237.148 |