| Red | Green | Blue | |
| z | 17.64 | ||
| znorm | Inf | ||
| sky | -Inf | -Inf | -Inf |
| S/N | 24.6 | 42.2 | 46.1 |
| S/N(c) | 0.0 | 0.0 | 0.0 |
| SN(E/C) |
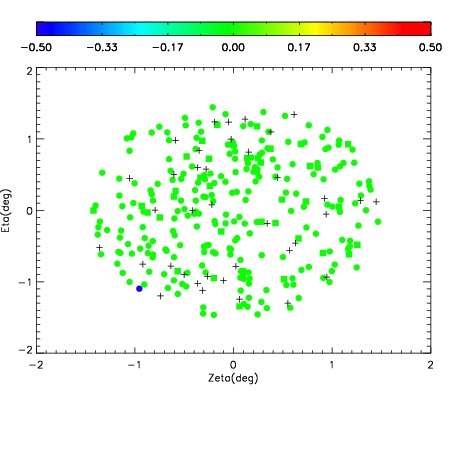
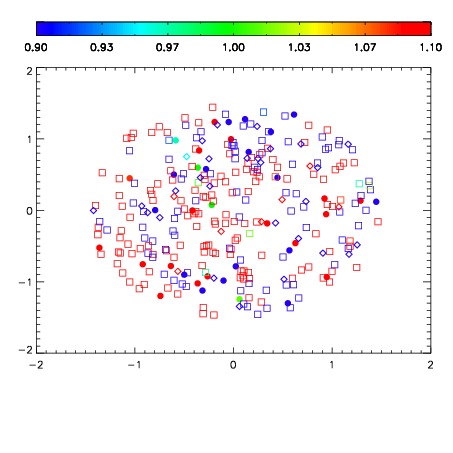
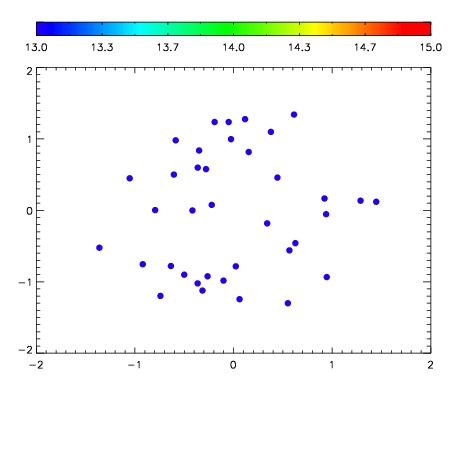

| Frame | Nreads | Zeropoints | Mag plots | Spatial mag deviation | Spatial sky 16325A emission deviations (filled: sky, open: star) | Spatial sky continuum emission | Spatial sky telluric CO2 absorption deviations (filled: H < 10) | |||||||||||||||||||||||
| 0 | 0 |
|
|
|
|
|
|
| IPAIR | NAME | SHIFT | NEWSHIFT | S/N | NAME | SHIFT | NEWSHIFT | S/N |
| 0 | 06090075 | 0.480981 | 0.00000 | 204.553 | 06090076 | -0.00245486 | 0.483436 | 211.422 |
| 1 | 06090078 | 0.477599 | 0.00338200 | 227.776 | 06090080 | -0.00284176 | 0.483823 | 216.222 |
| 2 | 06090079 | 0.478235 | 0.00274599 | 227.429 | 06090077 | -0.00408822 | 0.485069 | 212.696 |
| 3 | 06090074 | 0.480748 | 0.000232995 | 191.024 | 06090073 | 0.00000 | 0.480981 | 193.290 |