| Red | Green | Blue | |
| z | 17.64 | ||
| znorm | Inf | ||
| sky | -Inf | -Inf | -Inf |
| S/N | 29.5 | 50.2 | 56.0 |
| S/N(c) | 0.0 | 0.0 | 0.0 |
| SN(E/C) |
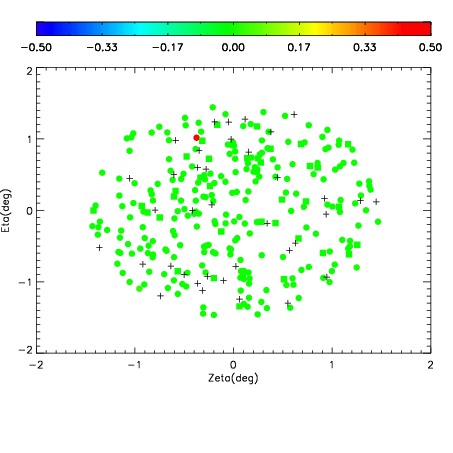
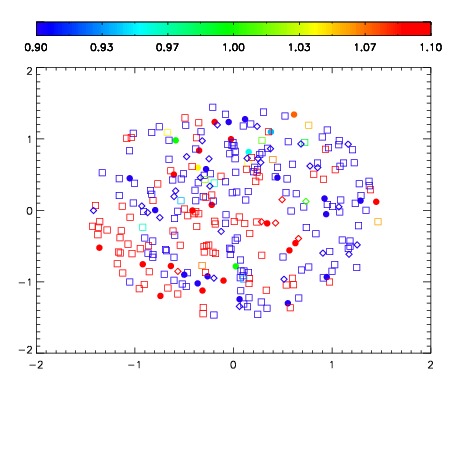
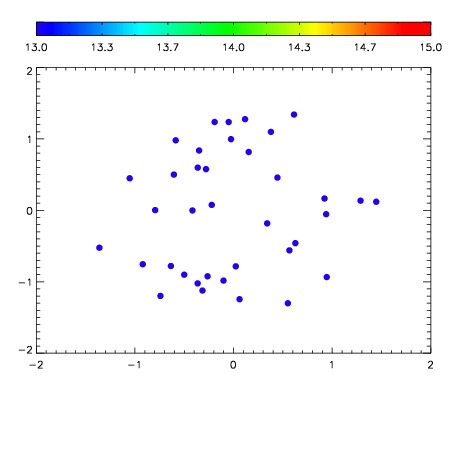

| Frame | Nreads | Zeropoints | Mag plots | Spatial mag deviation | Spatial sky 16325A emission deviations (filled: sky, open: star) | Spatial sky continuum emission | Spatial sky telluric CO2 absorption deviations (filled: H < 10) | |||||||||||||||||||||||
| 0 | 0 |
|
|
|
|
|
|
| IPAIR | NAME | SHIFT | NEWSHIFT | S/N | NAME | SHIFT | NEWSHIFT | S/N |
| 0 | 06150044 | 0.485791 | 0.00000 | 233.868 | 06150046 | -0.00208464 | 0.487876 | 233.541 |
| 1 | 06150043 | 0.479389 | 0.00640199 | 236.951 | 06150042 | 0.00000 | 0.485791 | 235.075 |
| 2 | 06150047 | 0.481213 | 0.00457799 | 235.000 | 06150045 | -0.000182292 | 0.485973 | 233.610 |
| 3 | 06150048 | 0.483049 | 0.00274199 | 232.203 | 06150049 | -0.000128298 | 0.485919 | 232.476 |