| Red | Green | Blue | |
| z | 17.64 | ||
| znorm | Inf | ||
| sky | -Inf | -Inf | -Inf |
| S/N | 26.5 | 46.0 | 48.3 |
| S/N(c) | 0.0 | 0.0 | 0.0 |
| SN(E/C) |
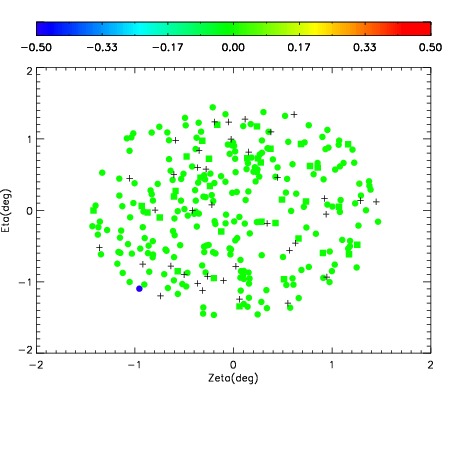
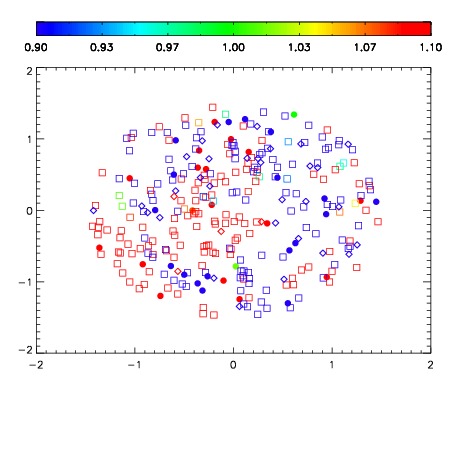
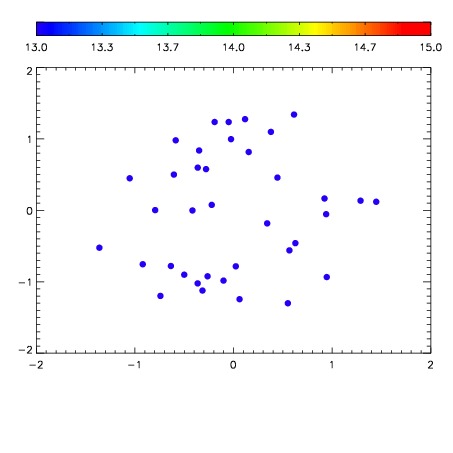

| Frame | Nreads | Zeropoints | Mag plots | Spatial mag deviation | Spatial sky 16325A emission deviations (filled: sky, open: star) | Spatial sky continuum emission | Spatial sky telluric CO2 absorption deviations (filled: H < 10) | |||||||||||||||||||||||
| 0 | 0 |
|
|
|
|
|
|
| IPAIR | NAME | SHIFT | NEWSHIFT | S/N | NAME | SHIFT | NEWSHIFT | S/N |
| 0 | 06670061 | 0.475436 | 0.00000 | 206.929 | 06670063 | 0.00135484 | 0.474081 | 206.979 |
| 1 | 06670060 | 0.475416 | 1.99974e-05 | 209.710 | 06670059 | 0.00000 | 0.475436 | 211.568 |
| 2 | 06670065 | 0.474935 | 0.000501007 | 205.040 | 06670062 | 0.000240596 | 0.475195 | 205.515 |
| 3 | 06670064 | 0.474327 | 0.00110900 | 204.272 | 06670066 | 0.00219027 | 0.473246 | 204.954 |