| Red | Green | Blue | |
| z | 17.64 | ||
| znorm | Inf | ||
| sky | -Inf | -Inf | -Inf |
| S/N | 24.6 | 44.0 | 47.1 |
| S/N(c) | 0.0 | 0.0 | 0.0 |
| SN(E/C) |
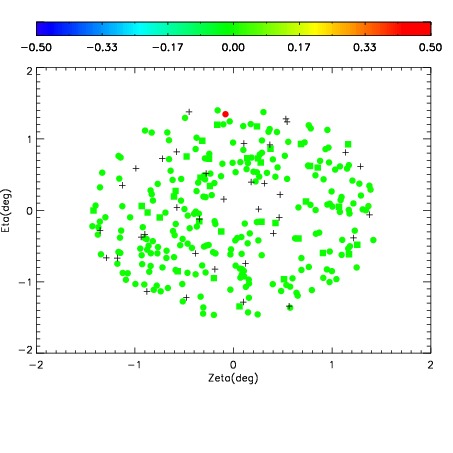
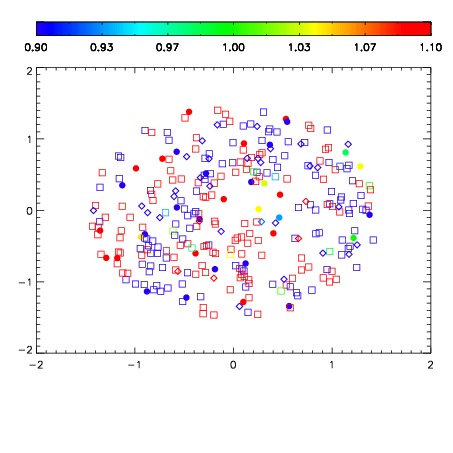
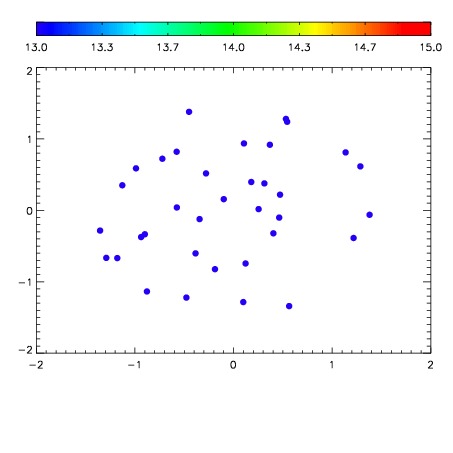

| Frame | Nreads | Zeropoints | Mag plots | Spatial mag deviation | Spatial sky 16325A emission deviations (filled: sky, open: star) | Spatial sky continuum emission | Spatial sky telluric CO2 absorption deviations (filled: H < 10) | |||||||||||||||||||||||
| 0 | 0 |
|
|
|
|
|
|
| IPAIR | NAME | SHIFT | NEWSHIFT | S/N | NAME | SHIFT | NEWSHIFT | S/N |
| 0 | 06100076 | 0.488519 | 0.00000 | 216.731 | 06100078 | -0.00165291 | 0.490172 | 217.467 |
| 1 | 06100080 | 0.487541 | 0.000978023 | 222.439 | 06100081 | 0.00604421 | 0.482475 | 226.176 |
| 2 | 06100075 | 0.488006 | 0.000513017 | 210.862 | 06100077 | 0.000262427 | 0.488257 | 199.266 |
| 3 | 06100079 | 0.488022 | 0.000497013 | 203.046 | 06100074 | 0.00000 | 0.488519 | 190.128 |