| Red | Green | Blue | |
| z | 17.64 | ||
| znorm | Inf | ||
| sky | -Inf | -Inf | -Inf |
| S/N | 14.0 | 26.3 | 28.2 |
| S/N(c) | 0.0 | 0.0 | 0.0 |
| SN(E/C) |
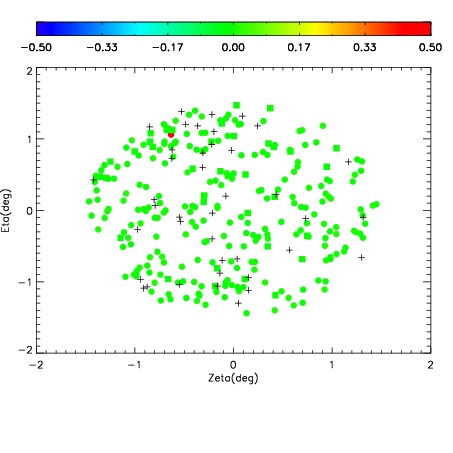
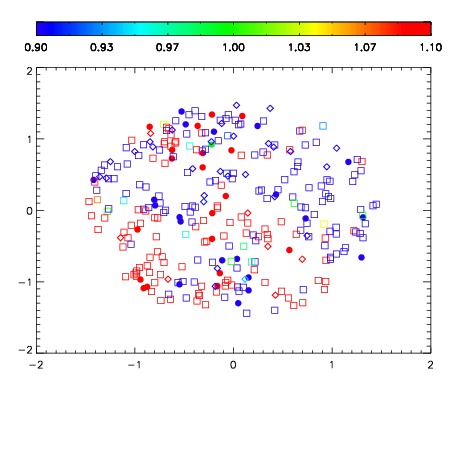


| Frame | Nreads | Zeropoints | Mag plots | Spatial mag deviation | Spatial sky 16325A emission deviations (filled: sky, open: star) | Spatial sky continuum emission | Spatial sky telluric CO2 absorption deviations (filled: H < 10) | |||||||||||||||||||||||
| 0 | 0 |
|
|
|
|
|
|
| IPAIR | NAME | SHIFT | NEWSHIFT | S/N | NAME | SHIFT | NEWSHIFT | S/N |
| 0 | 06110089 | 0.485867 | 0.00000 | 29.0530 | 06110087 | -0.000252989 | 0.486120 | 86.7053 |
| 1 | 06110090 | 0.483250 | 0.00261700 | 173.490 | 06110083 | -0.000804367 | 0.486671 | 130.204 |
| 2 | 06110086 | 0.484366 | 0.00150099 | 148.909 | 06110088 | -0.00197982 | 0.487847 | 129.291 |
| 3 | 06110082 | 0.484482 | 0.00138500 | 78.5308 | 06110091 | -0.00110638 | 0.486973 | 118.568 |
| 4 | 06110085 | 0.484152 | 0.00171500 | 70.7173 | 06110084 | -4.18116e-05 | 0.485909 | 93.6180 |
| 5 | 06110081 | 0.484333 | 0.00153399 | 50.4484 | 06110080 | 0.00000 | 0.485867 | 89.6945 |