| Red | Green | Blue | |
| z | 17.64 | ||
| znorm | Inf | ||
| sky | -Inf | -Inf | -Inf |
| S/N | 30.9 | 50.9 | 54.7 |
| S/N(c) | 0.0 | 0.0 | 0.0 |
| SN(E/C) |
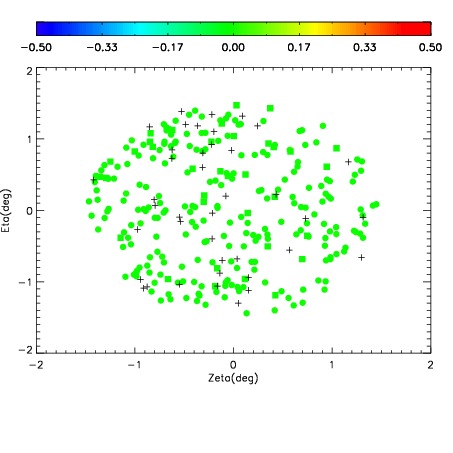
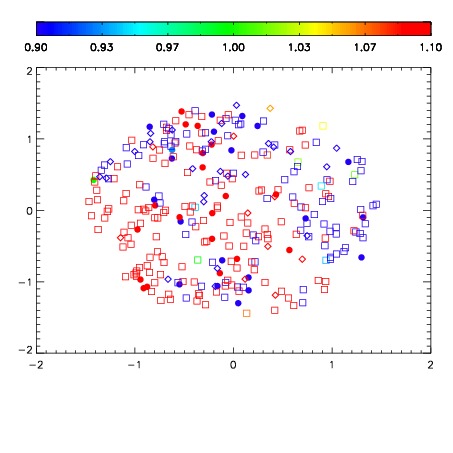
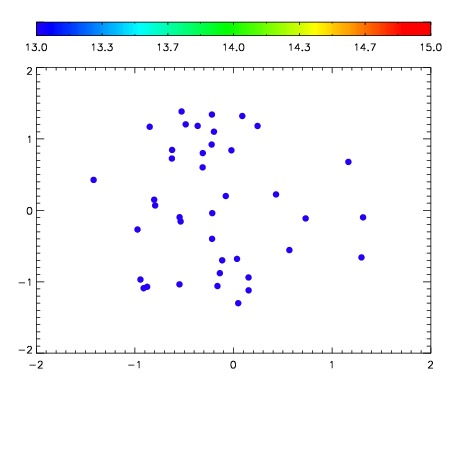

| Frame | Nreads | Zeropoints | Mag plots | Spatial mag deviation | Spatial sky 16325A emission deviations (filled: sky, open: star) | Spatial sky continuum emission | Spatial sky telluric CO2 absorption deviations (filled: H < 10) | |||||||||||||||||||||||
| 0 | 0 |
|
|
|
|
|
|
| IPAIR | NAME | SHIFT | NEWSHIFT | S/N | NAME | SHIFT | NEWSHIFT | S/N |
| 0 | 06410069 | 0.479278 | 0.00000 | 200.921 | 06410068 | 0.00000 | 0.479278 | 202.101 |
| 1 | 06410070 | 0.479274 | 3.99351e-06 | 198.071 | 06410075 | 0.00617941 | 0.473099 | 198.988 |
| 2 | 06410074 | 0.478547 | 0.000730991 | 196.767 | 06410071 | 0.00280870 | 0.476469 | 194.318 |
| 3 | 06410073 | 0.478044 | 0.00123399 | 194.494 | 06410072 | 0.00368241 | 0.475596 | 193.617 |