| Red | Green | Blue | |
| z | 17.64 | ||
| znorm | Inf | ||
| sky | -Inf | -Inf | -Inf |
| S/N | 26.3 | 47.4 | 50.4 |
| S/N(c) | 0.0 | 0.0 | 0.0 |
| SN(E/C) |
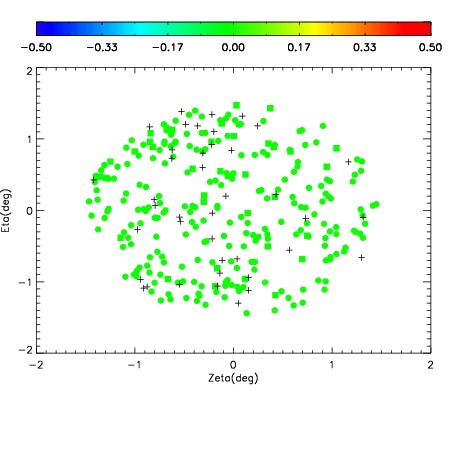
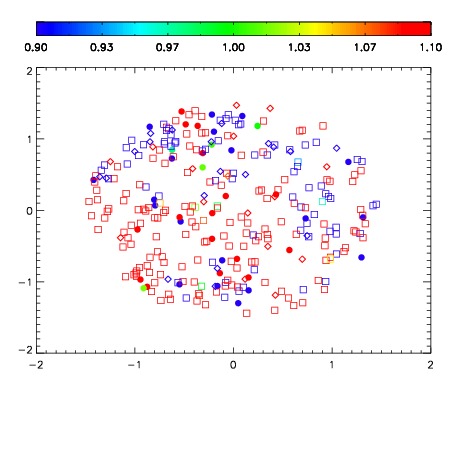
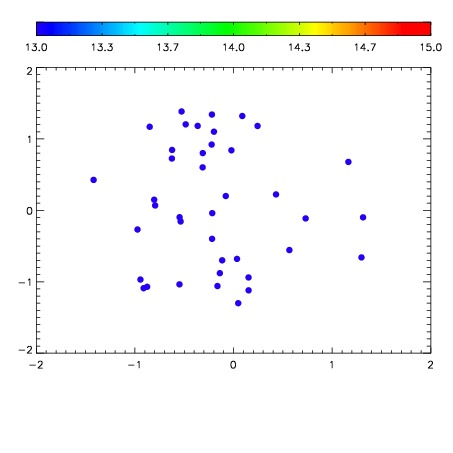

| Frame | Nreads | Zeropoints | Mag plots | Spatial mag deviation | Spatial sky 16325A emission deviations (filled: sky, open: star) | Spatial sky continuum emission | Spatial sky telluric CO2 absorption deviations (filled: H < 10) | |||||||||||||||||||||||
| 0 | 0 |
|
|
|
|
|
|
| IPAIR | NAME | SHIFT | NEWSHIFT | S/N | NAME | SHIFT | NEWSHIFT | S/N |
| 0 | 06650065 | 0.483270 | 0.00000 | 195.387 | 06650063 | 0.00287086 | 0.480399 | 193.273 |
| 1 | 06650060 | 0.479757 | 0.00351298 | 197.988 | 06650062 | 0.00168426 | 0.481586 | 200.062 |
| 2 | 06650061 | 0.480375 | 0.00289500 | 196.266 | 06650059 | 0.00000 | 0.483270 | 194.124 |
| 3 | 06650064 | 0.482746 | 0.000523984 | 181.910 | 06650066 | 0.00319809 | 0.480072 | 189.061 |