| Red | Green | Blue | |
| z | 17.64 | ||
| znorm | Inf | ||
| sky | -Inf | -Inf | -Inf |
| S/N | 30.6 | 51.9 | 54.9 |
| S/N(c) | 0.0 | 0.0 | 0.0 |
| SN(E/C) |

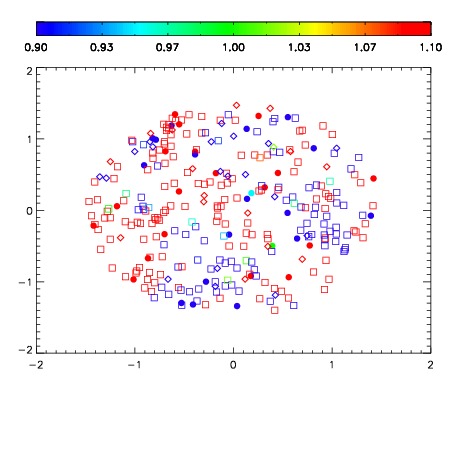
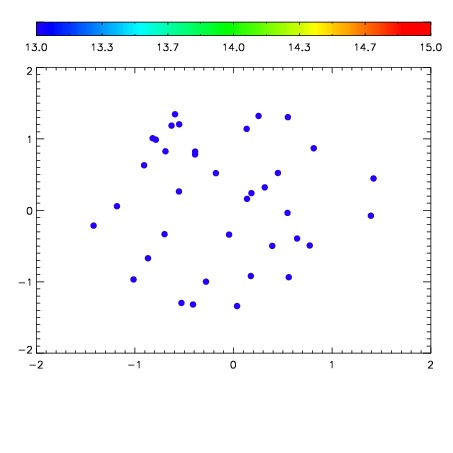

| Frame | Nreads | Zeropoints | Mag plots | Spatial mag deviation | Spatial sky 16325A emission deviations (filled: sky, open: star) | Spatial sky continuum emission | Spatial sky telluric CO2 absorption deviations (filled: H < 10) | |||||||||||||||||||||||
| 0 | 0 |
|
|
|
|
|
|
| IPAIR | NAME | SHIFT | NEWSHIFT | S/N | NAME | SHIFT | NEWSHIFT | S/N |
| 0 | 06700058 | 0.486469 | 0.00000 | 207.637 | 06700052 | 0.00000 | 0.486469 | 203.742 |
| 1 | 06700053 | 0.477960 | 0.00850901 | 209.543 | 06700059 | -8.81146e-05 | 0.486557 | 211.838 |
| 2 | 06700057 | 0.484106 | 0.00236300 | 209.270 | 06700055 | -0.00444309 | 0.490912 | 208.829 |
| 3 | 06700054 | 0.479765 | 0.00670400 | 208.283 | 06700056 | -0.00693850 | 0.493407 | 207.391 |