| Red | Green | Blue | |
| z | 17.64 | ||
| znorm | Inf | ||
| sky | -Inf | -Inf | -Inf |
| S/N | 28.6 | 51.0 | 53.1 |
| S/N(c) | 0.0 | 0.0 | 0.0 |
| SN(E/C) |

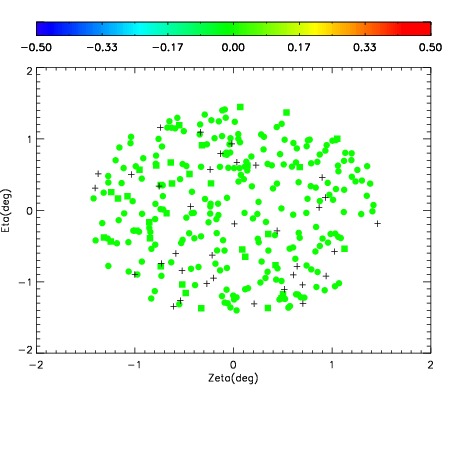
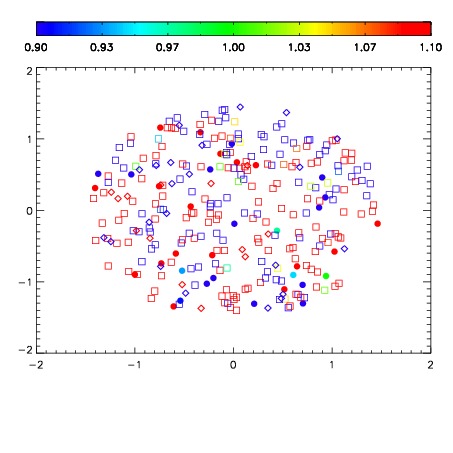
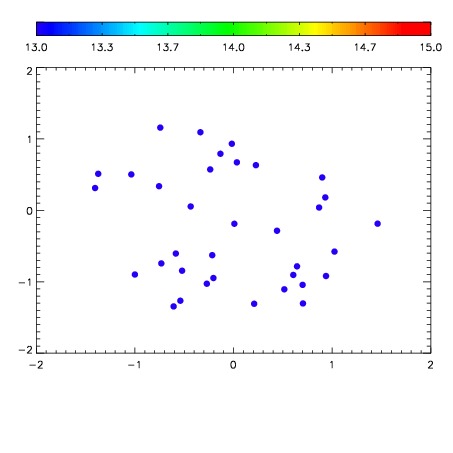

| Frame | Nreads | Zeropoints | Mag plots | Spatial mag deviation | Spatial sky 16325A emission deviations (filled: sky, open: star) | Spatial sky continuum emission | Spatial sky telluric CO2 absorption deviations (filled: H < 10) | |||||||||||||||||||||||
| 0 | 0 |
|
|
|
|
|
|
| IPAIR | NAME | SHIFT | NEWSHIFT | S/N | NAME | SHIFT | NEWSHIFT | S/N |
| 0 | 06070070 | 0.478330 | 0.00000 | 190.646 | 06070073 | -0.00137764 | 0.479708 | 184.079 |
| 1 | 06070071 | 0.477922 | 0.000407994 | 191.195 | 06070072 | 0.000804497 | 0.477526 | 187.150 |
| 2 | 06070075 | 0.477482 | 0.000847995 | 188.549 | 06070076 | 4.57090e-05 | 0.478284 | 182.909 |
| 3 | 06070074 | 0.476727 | 0.00160298 | 176.498 | 06070069 | 0.00000 | 0.478330 | 180.675 |