| Red | Green | Blue | |
| z | 17.64 | ||
| znorm | Inf | ||
| sky | -Inf | -Inf | -Inf |
| S/N | 29.5 | 49.5 | 54.3 |
| S/N(c) | 0.0 | 0.0 | 0.0 |
| SN(E/C) |
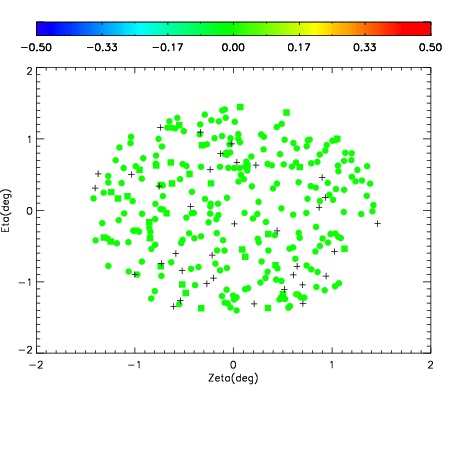
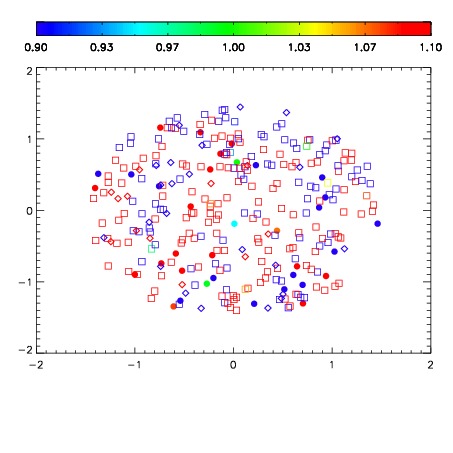
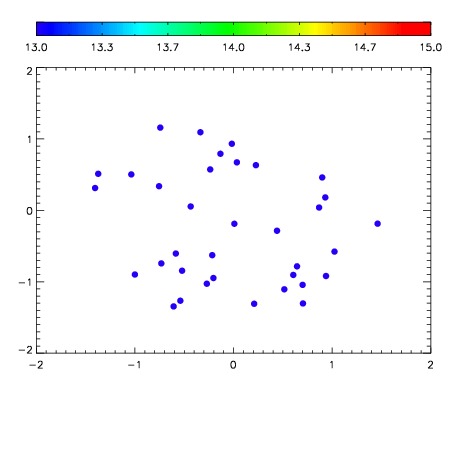

| Frame | Nreads | Zeropoints | Mag plots | Spatial mag deviation | Spatial sky 16325A emission deviations (filled: sky, open: star) | Spatial sky continuum emission | Spatial sky telluric CO2 absorption deviations (filled: H < 10) | |||||||||||||||||||||||
| 0 | 0 |
|
|
|
|
|
|
| IPAIR | NAME | SHIFT | NEWSHIFT | S/N | NAME | SHIFT | NEWSHIFT | S/N |
| 0 | 06410062 | 0.475694 | 0.00000 | 196.475 | 06410064 | 0.000262913 | 0.475431 | 196.480 |
| 1 | 06410063 | 0.475633 | 6.10054e-05 | 196.436 | 06410060 | 0.00171278 | 0.473981 | 195.583 |
| 2 | 06410058 | 0.474451 | 0.00124300 | 194.968 | 06410061 | -0.000148646 | 0.475843 | 195.443 |
| 3 | 06410059 | 0.474373 | 0.00132099 | 194.270 | 06410057 | 0.00000 | 0.475694 | 190.911 |