| Red | Green | Blue | |
| z | 17.64 | ||
| znorm | Inf | ||
| sky | -Inf | -Inf | -Inf |
| S/N | 23.3 | 43.3 | 47.8 |
| S/N(c) | 0.0 | 0.0 | 0.0 |
| SN(E/C) |

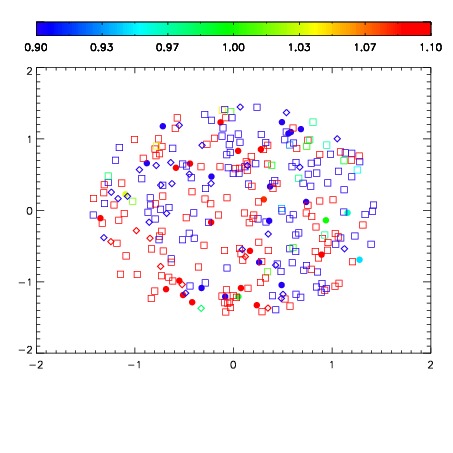
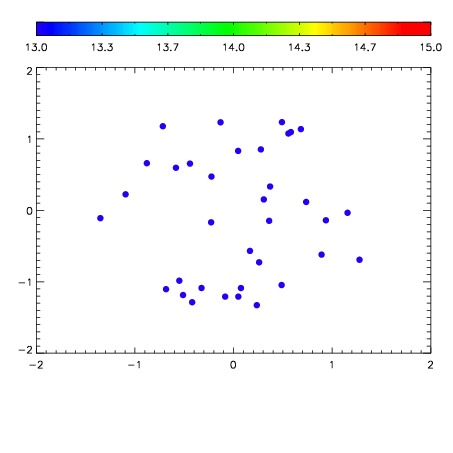

| Frame | Nreads | Zeropoints | Mag plots | Spatial mag deviation | Spatial sky 16325A emission deviations (filled: sky, open: star) | Spatial sky continuum emission | Spatial sky telluric CO2 absorption deviations (filled: H < 10) | |||||||||||||||||||||||
| 0 | 0 |
|
|
|
|
|
|
| IPAIR | NAME | SHIFT | NEWSHIFT | S/N | NAME | SHIFT | NEWSHIFT | S/N |
| 0 | 06080081 | 0.487557 | 0.00000 | 175.868 | 06080084 | -4.92798e-05 | 0.487606 | 180.790 |
| 1 | 06080085 | 0.482752 | 0.00480500 | 175.773 | 06080083 | 0.00162704 | 0.485930 | 173.390 |
| 2 | 06080082 | 0.487332 | 0.000225008 | 174.822 | 06080080 | 0.00000 | 0.487557 | 172.379 |
| 3 | 06080086 | 0.482237 | 0.00531998 | 145.968 | 06080087 | 0.00212481 | 0.485432 | 166.677 |