| Red | Green | Blue | |
| z | 17.64 | ||
| znorm | Inf | ||
| sky | -Inf | -Inf | -Inf |
| S/N | 27.1 | 46.1 | 53.5 |
| S/N(c) | 0.0 | 0.0 | 0.0 |
| SN(E/C) |
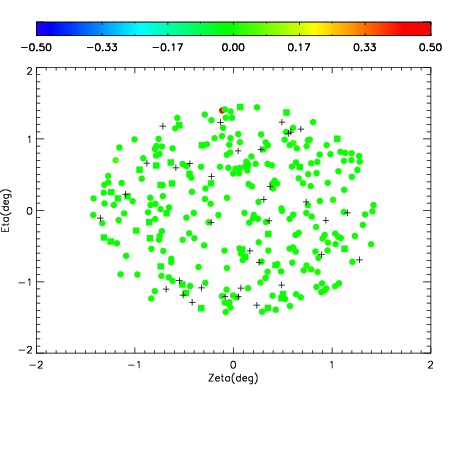
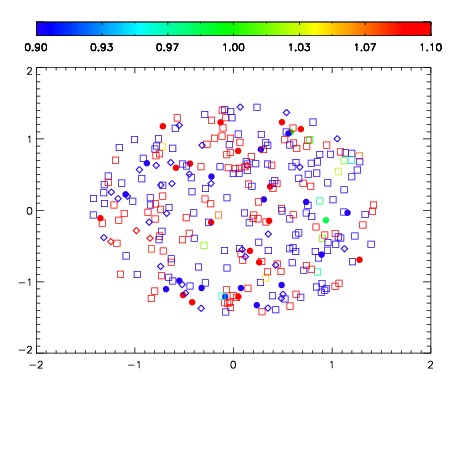
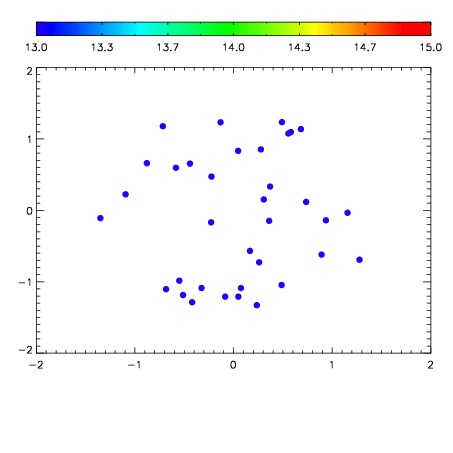

| Frame | Nreads | Zeropoints | Mag plots | Spatial mag deviation | Spatial sky 16325A emission deviations (filled: sky, open: star) | Spatial sky continuum emission | Spatial sky telluric CO2 absorption deviations (filled: H < 10) | |||||||||||||||||||||||
| 0 | 0 |
|
|
|
|
|
|
| IPAIR | NAME | SHIFT | NEWSHIFT | S/N | NAME | SHIFT | NEWSHIFT | S/N |
| 0 | 06150033 | 0.483977 | 0.00000 | 137.339 | 06150031 | 0.00000 | 0.483977 | 203.622 |
| 1 | 06150037 | 0.478976 | 0.00500098 | 216.171 | 06150038 | 0.000401574 | 0.483575 | 217.577 |
| 2 | 06150036 | 0.476791 | 0.00718600 | 216.116 | 06150035 | -0.00230343 | 0.486280 | 212.812 |
| 3 | 06150032 | 0.478203 | 0.00577399 | 181.933 | 06150034 | -0.00127979 | 0.485257 | 211.525 |