| Red | Green | Blue | |
| z | 17.64 | ||
| znorm | Inf | ||
| sky | -Inf | -Inf | -Inf |
| S/N | 30.9 | 53.2 | 57.1 |
| S/N(c) | 0.0 | 0.0 | 0.0 |
| SN(E/C) |
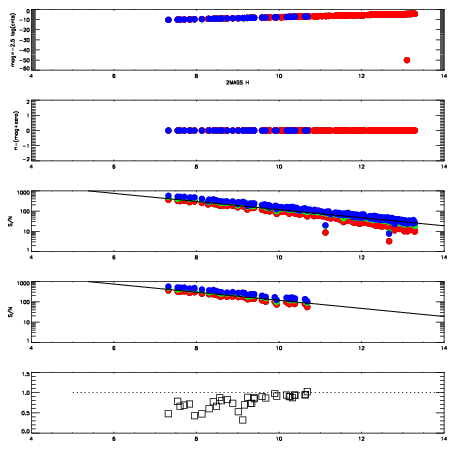
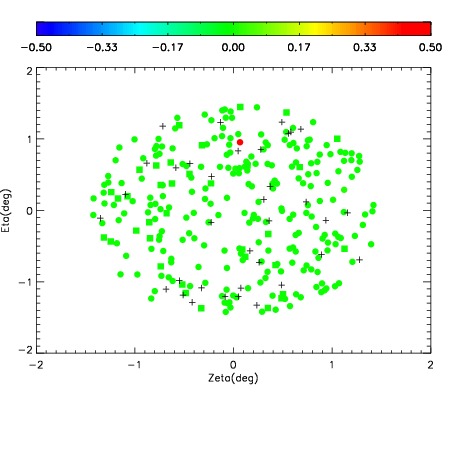
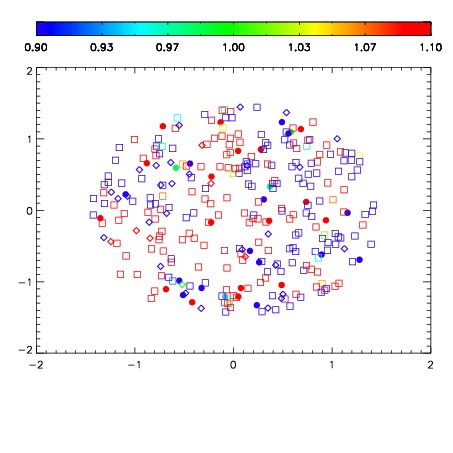
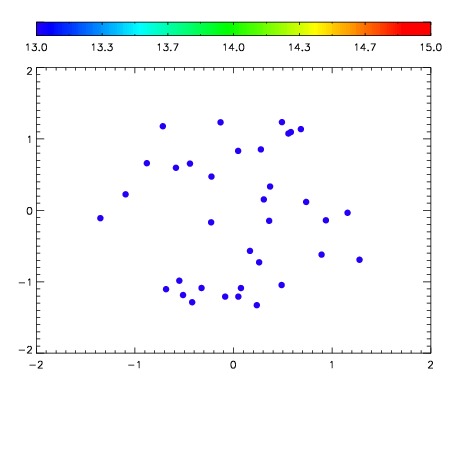

| Frame | Nreads | Zeropoints | Mag plots | Spatial mag deviation | Spatial sky 16325A emission deviations (filled: sky, open: star) | Spatial sky continuum emission | Spatial sky telluric CO2 absorption deviations (filled: H < 10) | |||||||||||||||||||||||
| 0 | 0 |
|
|
|
|
|
|
| IPAIR | NAME | SHIFT | NEWSHIFT | S/N | NAME | SHIFT | NEWSHIFT | S/N |
| 0 | 06440043 | 0.471256 | 0.00000 | 200.055 | 06440037 | 0.00000 | 0.471256 | 200.585 |
| 1 | 06440042 | 0.470593 | 0.000662982 | 206.216 | 06440041 | 2.84153e-05 | 0.471228 | 205.796 |
| 2 | 06440039 | 0.468645 | 0.00261098 | 203.389 | 06440044 | 9.00495e-05 | 0.471166 | 204.027 |
| 3 | 06440038 | 0.468893 | 0.00236300 | 201.016 | 06440040 | -0.00156138 | 0.472817 | 203.389 |