| Red | Green | Blue | |
| z | 17.64 | ||
| znorm | Inf | ||
| sky | -NaN | -NaN | -Inf |
| S/N | 28.3 | 47.7 | 56.4 |
| S/N(c) | 0.0 | 0.0 | 0.0 |
| SN(E/C) |
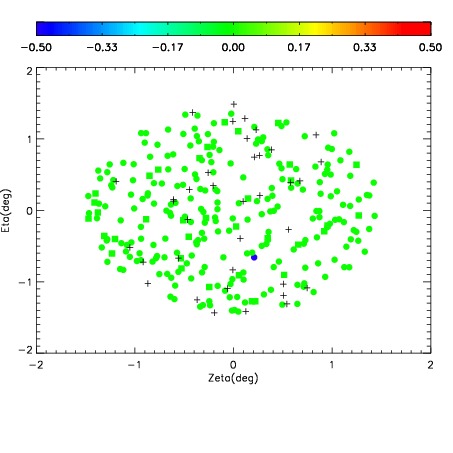
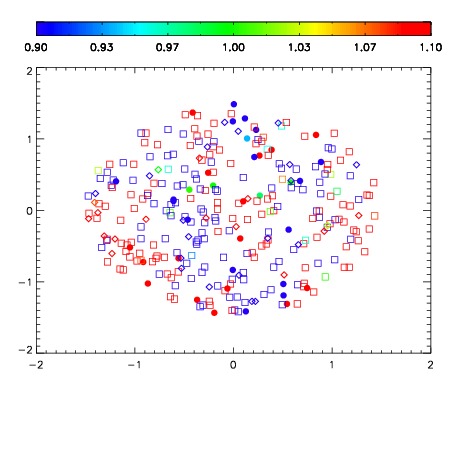
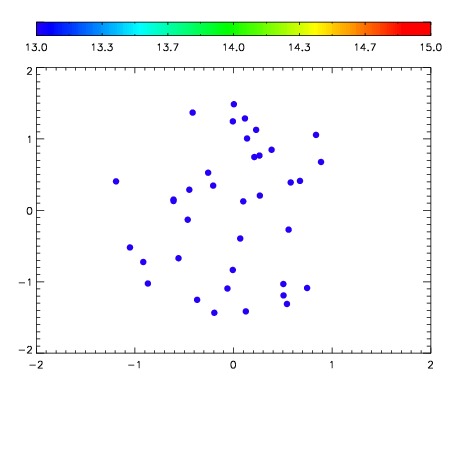

| Frame | Nreads | Zeropoints | Mag plots | Spatial mag deviation | Spatial sky 16325A emission deviations (filled: sky, open: star) | Spatial sky continuum emission | Spatial sky telluric CO2 absorption deviations (filled: H < 10) | |||||||||||||||||||||||
| 0 | 0 |
|
|
|
|
|
|
| IPAIR | NAME | SHIFT | NEWSHIFT | S/N | NAME | SHIFT | NEWSHIFT | S/N |
| 0 | 06400070 | 0.488950 | 0.00000 | 153.154 | 06400068 | -0.000113319 | 0.489063 | 154.863 |
| 1 | 06400069 | 0.488454 | 0.000496000 | 157.527 | 06400071 | 0.00413160 | 0.484818 | 161.671 |
| 2 | 06400065 | 0.487270 | 0.00168002 | 150.527 | 06400067 | -0.000582622 | 0.489533 | 152.775 |
| 3 | 06400066 | 0.487041 | 0.00190902 | 146.686 | 06400064 | 0.00000 | 0.488950 | 148.759 |