| Red | Green | Blue | |
| z | 17.64 | ||
| znorm | Inf | ||
| sky | -Inf | -Inf | -Inf |
| S/N | 25.2 | 46.4 | 48.7 |
| S/N(c) | 0.0 | 0.0 | 0.0 |
| SN(E/C) |
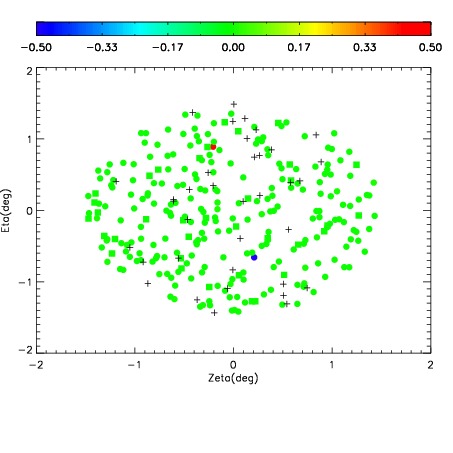
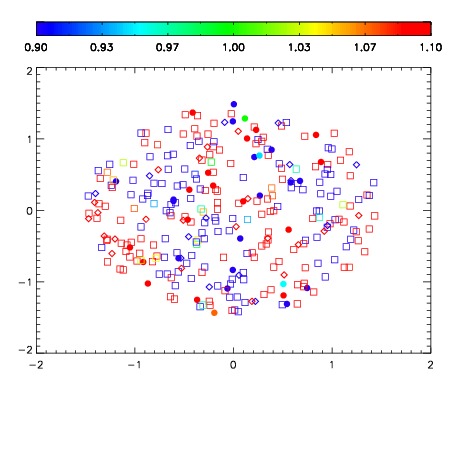
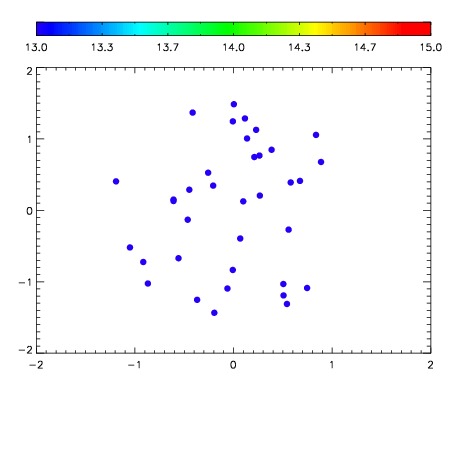

| Frame | Nreads | Zeropoints | Mag plots | Spatial mag deviation | Spatial sky 16325A emission deviations (filled: sky, open: star) | Spatial sky continuum emission | Spatial sky telluric CO2 absorption deviations (filled: H < 10) | |||||||||||||||||||||||
| 0 | 0 |
|
|
|
|
|
|
| IPAIR | NAME | SHIFT | NEWSHIFT | S/N | NAME | SHIFT | NEWSHIFT | S/N |
| 0 | 06630051 | 0.485896 | 0.00000 | 146.136 | 06630045 | 0.00000 | 0.485896 | 143.803 |
| 1 | 06630047 | 0.483071 | 0.00282499 | 143.770 | 06630048 | 0.00210395 | 0.483792 | 142.381 |
| 2 | 06630050 | 0.485351 | 0.000544995 | 142.928 | 06630052 | 0.00318994 | 0.482706 | 141.202 |
| 3 | 06630046 | 0.482495 | 0.00340098 | 138.291 | 06630049 | -0.00168886 | 0.487585 | 139.310 |