| Red | Green | Blue | |
| z | 17.64 | ||
| znorm | Inf | ||
| sky | -Inf | -Inf | -Inf |
| S/N | 29.7 | 51.8 | 56.1 |
| S/N(c) | 0.0 | 0.0 | 0.0 |
| SN(E/C) |
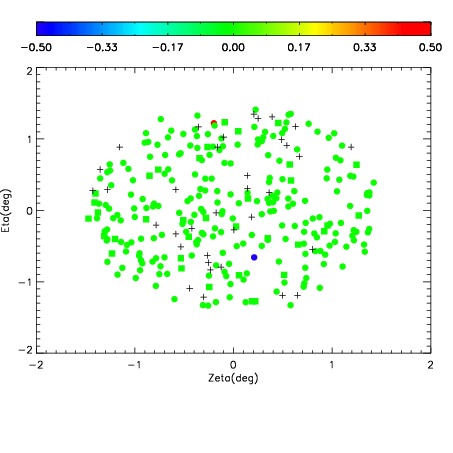
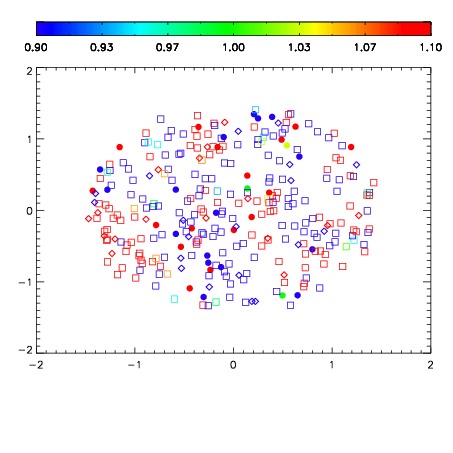
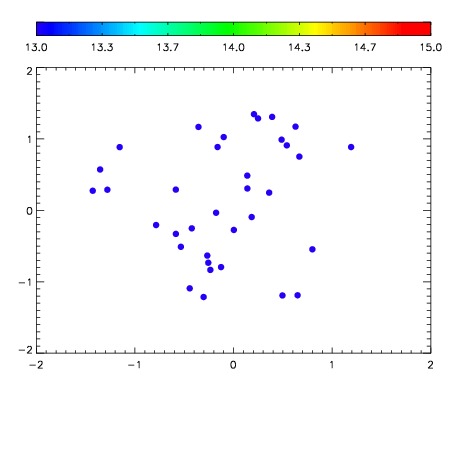

| Frame | Nreads | Zeropoints | Mag plots | Spatial mag deviation | Spatial sky 16325A emission deviations (filled: sky, open: star) | Spatial sky continuum emission | Spatial sky telluric CO2 absorption deviations (filled: H < 10) | |||||||||||||||||||||||
| 0 | 0 |
|
|
|
|
|
|
| IPAIR | NAME | SHIFT | NEWSHIFT | S/N | NAME | SHIFT | NEWSHIFT | S/N |
| 0 | 06380054 | 0.485484 | 0.00000 | 147.130 | 06380055 | 0.00271693 | 0.482767 | 144.541 |
| 1 | 06380058 | 0.481067 | 0.00441700 | 154.107 | 06380059 | 0.00172323 | 0.483761 | 153.935 |
| 2 | 06380057 | 0.481368 | 0.00411600 | 151.689 | 06380056 | 0.0185203 | 0.466964 | 148.797 |
| 3 | 06380053 | 0.484967 | 0.000517011 | 143.983 | 06380052 | 0.00000 | 0.485484 | 143.714 |