| Red | Green | Blue | |
| z | 17.64 | ||
| znorm | Inf | ||
| sky | -Inf | -Inf | -Inf |
| S/N | 27.4 | 49.1 | 52.9 |
| S/N(c) | 0.0 | 0.0 | 0.0 |
| SN(E/C) |
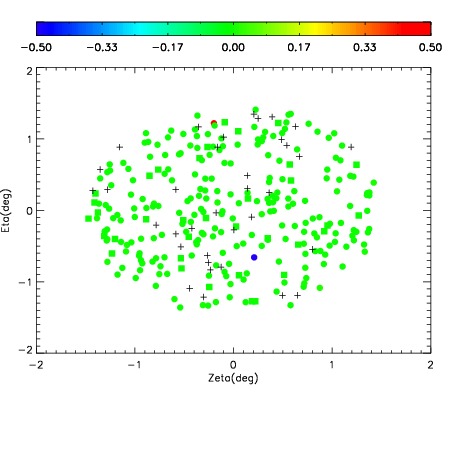

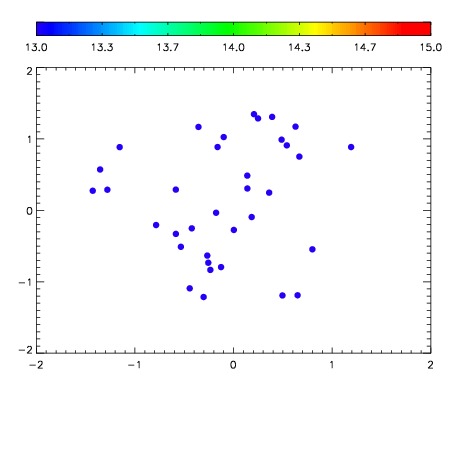

| Frame | Nreads | Zeropoints | Mag plots | Spatial mag deviation | Spatial sky 16325A emission deviations (filled: sky, open: star) | Spatial sky continuum emission | Spatial sky telluric CO2 absorption deviations (filled: H < 10) | |||||||||||||||||||||||
| 0 | 0 |
|
|
|
|
|
|
| IPAIR | NAME | SHIFT | NEWSHIFT | S/N | NAME | SHIFT | NEWSHIFT | S/N |
| 0 | 06420061 | 0.479023 | 0.00000 | 77.3660 | 06420055 | 0.00000 | 0.479023 | 88.6979 |
| 1 | 06420065 | 0.477290 | 0.00173301 | 107.223 | 06420058 | -0.00183197 | 0.480855 | 97.2082 |
| 2 | 06420057 | 0.477839 | 0.00118402 | 100.210 | 06420059 | -0.00119591 | 0.480219 | 96.5126 |
| 3 | 06420056 | 0.478280 | 0.000743002 | 92.2502 | 06420062 | -0.00241120 | 0.481434 | 92.5403 |
| 4 | 06420064 | 0.477095 | 0.00192800 | 87.8251 | 06420066 | -0.00305216 | 0.482075 | 90.9308 |
| 5 | 06420060 | 0.478388 | 0.000634998 | 75.0833 | 06420063 | -0.00368124 | 0.482704 | 83.2471 |