| Frame | Nreads | Zeropoints | Mag plots
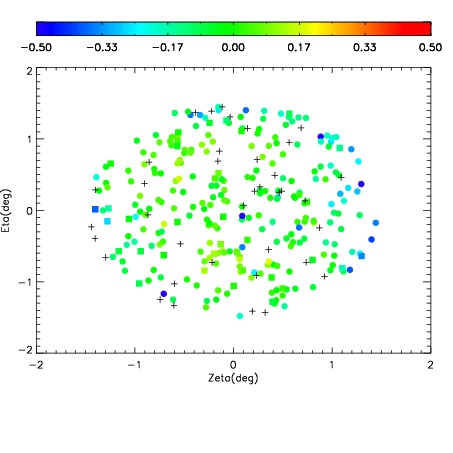
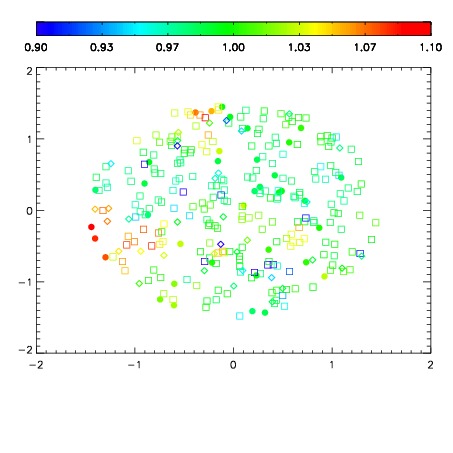
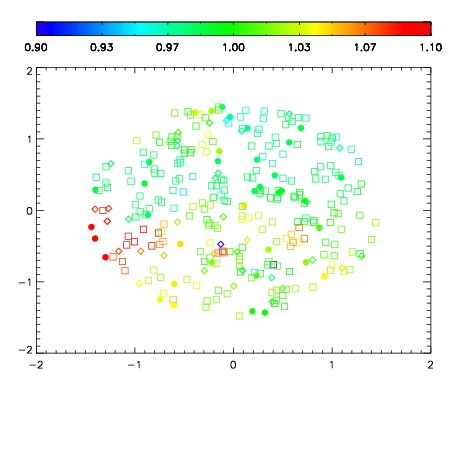
| Spatial mag deviation
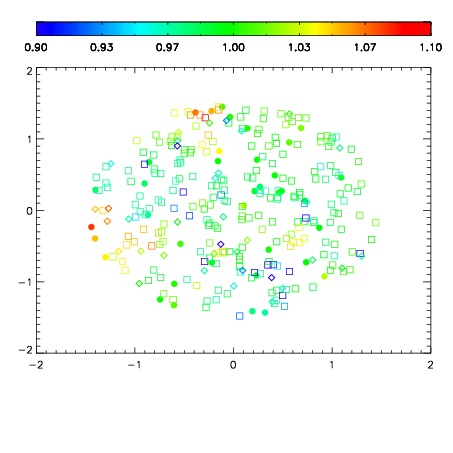
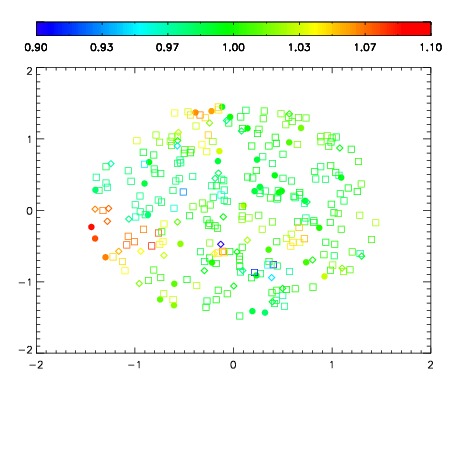
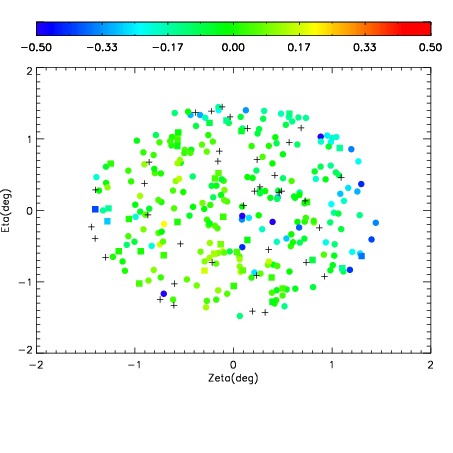
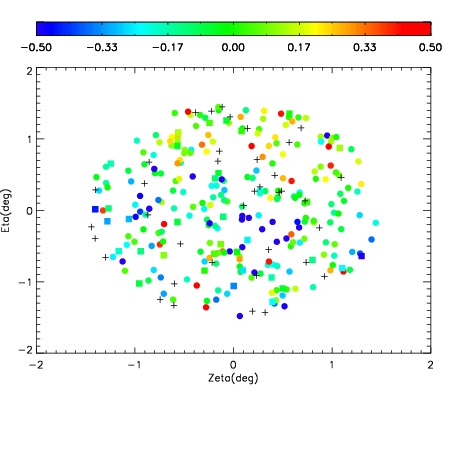
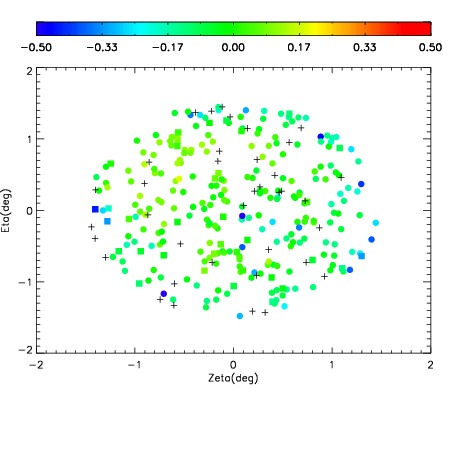
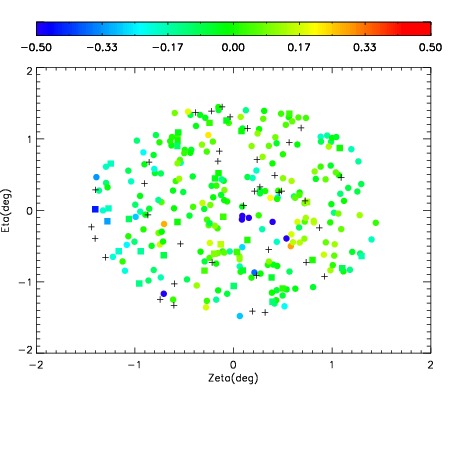
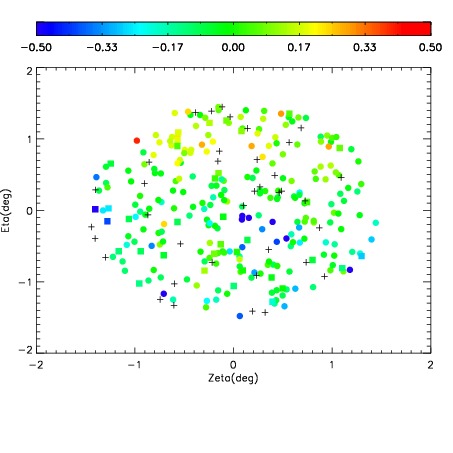
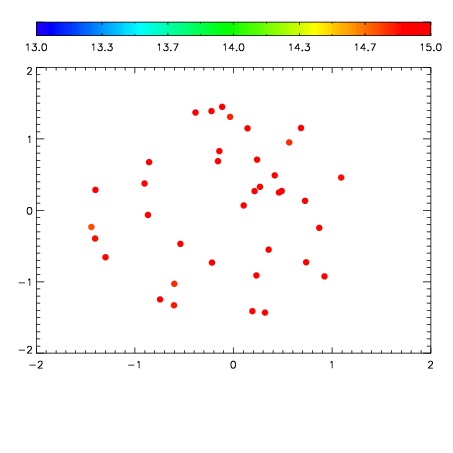
| Spatial sky 16325A emission deviations (filled: sky, open: star)
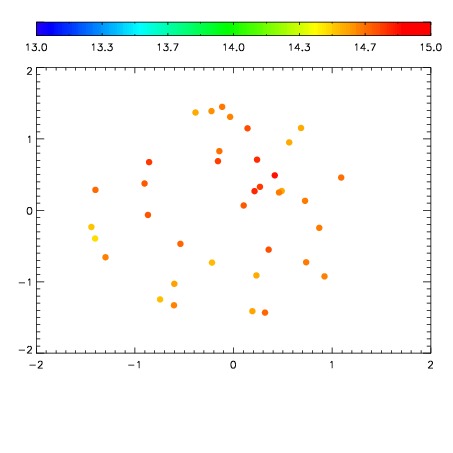
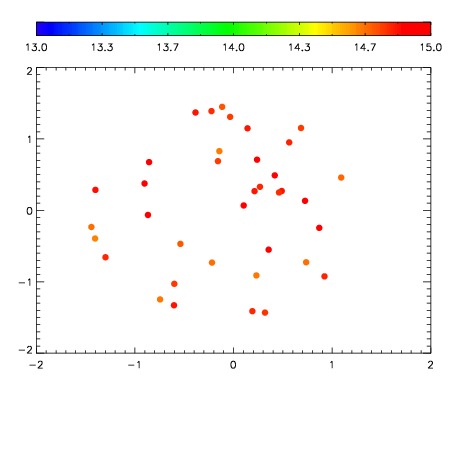
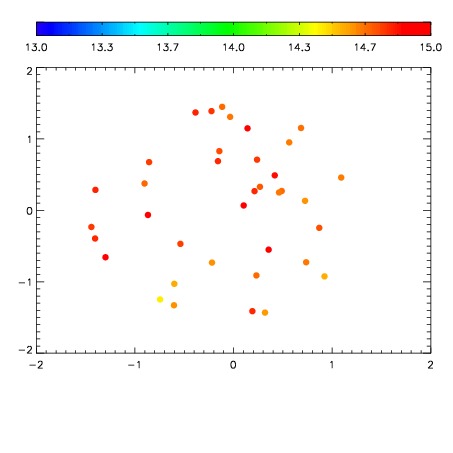
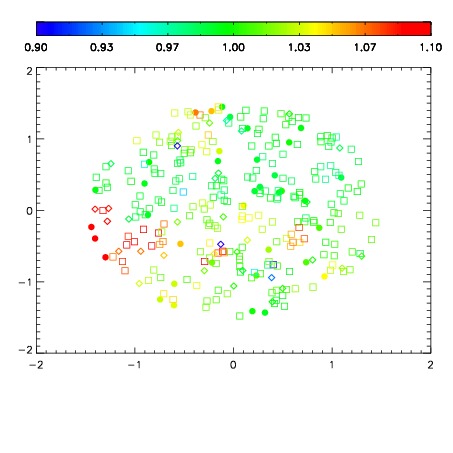
| Spatial sky continuum emission
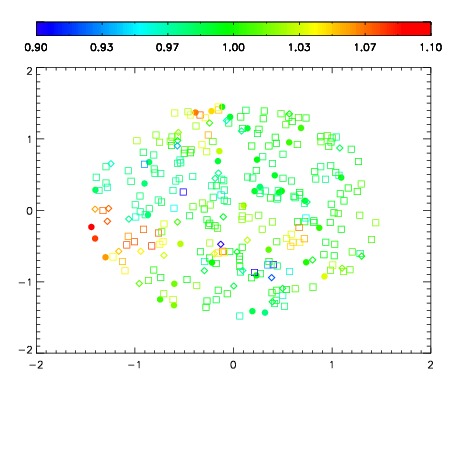
| Spatial sky telluric CO2 absorption deviations (filled: H < 10)
|
| 6330061
| 47
| | Red | Green | Blue
| | z | | 19.01
| | znorm | | 14.83
| | sky | 15.2 | 14.8 | 14.8
| | S/N | 15.6 | 25.7 | 27.7
| | S/N(c) | 13.5 | 23.6 | 25.6
| | SN(E/C) 0.96
|
| 
| 
| 
| 
| 
|
| 6330062
| 47
| | Red | Green | Blue
| | z | | 18.54
| | znorm | | 14.36
| | sky | 14.9 | 14.6 | 15.2
| | S/N | 11.5 | 19.6 | 21.2
| | S/N(c) | 9.9 | 18.2 | 19.4
| | SN(E/C) 1.00
|
| 
| 
| 
| 
| 
|
| 6330063
| 47
| | Red | Green | Blue
| | z | | 17.53
| | znorm | | 13.35
| | sky | 14.8 | 14.7 | 15.4
| | S/N | 4.9 | 10.6 | 11.3
| | S/N(c) | 4.2 | 9.7 | 10.1
| | SN(E/C) 1.03
|
| 
| 
| 
| 
| 
|
| 6330064
| 47
| | Red | Green | Blue
| | z | | 17.82
| | znorm | | 13.64
| | sky | 14.7 | 14.8 | 15.1
| | S/N | 6.2 | 12.7 | 13.5
| | S/N(c) | 5.2 | 11.4 | 12.1
| | SN(E/C) 0.99
|
| 
| 
| 
| 
| 
|
| 6330065
| 47
| | Red | Green | Blue
| | z | | 15.59
| | znorm | | 11.41
| | sky | 14.8 | 14.8 | 15.3
| | S/N | 0.8 | 2.7 | 2.1
| | S/N(c) | 0.0 | 0.0 | 0.0
| | SN(E/C) 0.84
|
| 
| 
| 
| 
| 
|
| 6330066
| 47
| | Red | Green | Blue
| | z | | 18.77
| | znorm | | 14.59
| | sky | 14.8 | 14.7 | 15.2
| | S/N | 13.2 | 22.4 | 24.7
| | S/N(c) | 11.4 | 20.5 | 22.9
| | SN(E/C) 0.93
|
| 
| 
| 
| 
| 
|
| 6330067
| 47
| | Red | Green | Blue
| | z | | 16.70
| | znorm | | 12.52
| | sky | 14.8 | 15.0 | 15.4
| | S/N | 2.1 | 5.8 | 5.6
| | S/N(c) | 1.9 | 5.0 | 5.0
| | SN(E/C) 1.07
|
| 
| 
| 
| 
| 
|
| 6330068
| 47
| | Red | Green | Blue
| | z | | 16.62
| | znorm | | 12.44
| | sky | 14.9 | 15.0 | 15.4
| | S/N | 2.1 | 5.6 | 5.8
| | S/N(c) | 1.9 | 5.2 | 5.3
| | SN(E/C) 0.99
|
| 
| 
| 
| 
| 
|