| Red | Green | Blue | |
| z | 17.64 | ||
| znorm | Inf | ||
| sky | -Inf | -Inf | -Inf |
| S/N | 15.2 | 27.3 | 29.9 |
| S/N(c) | 0.0 | 0.0 | 0.0 |
| SN(E/C) |
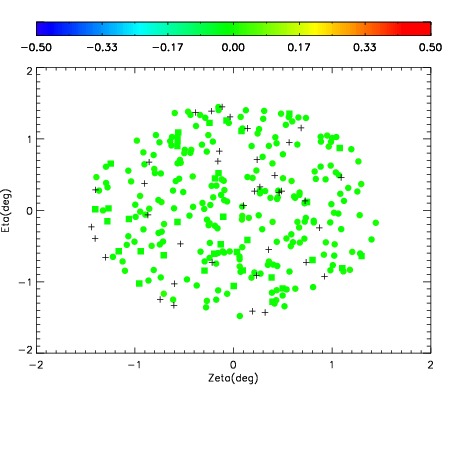
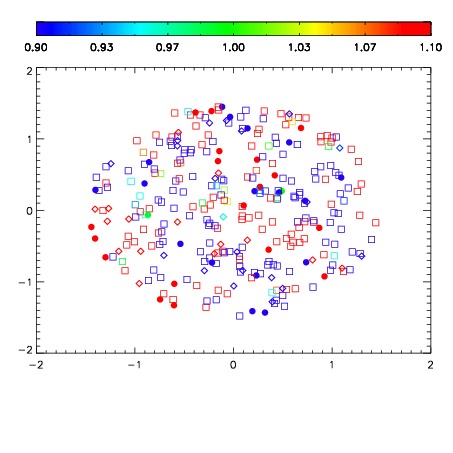
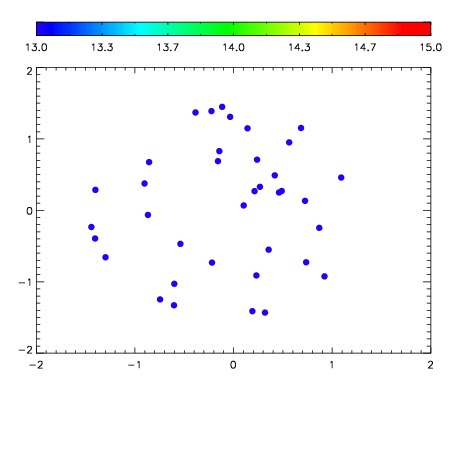

| Frame | Nreads | Zeropoints | Mag plots | Spatial mag deviation | Spatial sky 16325A emission deviations (filled: sky, open: star) | Spatial sky continuum emission | Spatial sky telluric CO2 absorption deviations (filled: H < 10) | |||||||||||||||||||||||
| 0 | 0 |
|
|
|
|
|
|
| IPAIR | NAME | SHIFT | NEWSHIFT | S/N | NAME | SHIFT | NEWSHIFT | S/N |
| 0 | 06330063 | 0.473495 | 0.00000 | 95.9116 | 06330068 | 0.00403169 | 0.469463 | 67.7115 |
| 1 | 06330066 | 0.469849 | 0.00364602 | 169.739 | 06330061 | 0.00000 | 0.473495 | 184.138 |
| 2 | 06330062 | 0.472598 | 0.000897020 | 149.981 | 06330064 | 0.000734096 | 0.472761 | 105.368 |