| Red | Green | Blue | |
| z | 17.64 | ||
| znorm | Inf | ||
| sky | -Inf | -Inf | -Inf |
| S/N | 29.1 | 50.9 | 55.1 |
| S/N(c) | 0.0 | 0.0 | 0.0 |
| SN(E/C) |

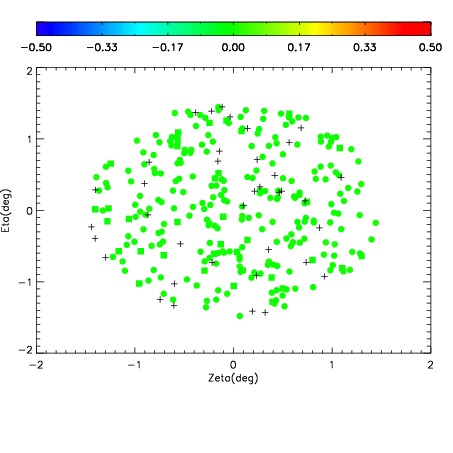
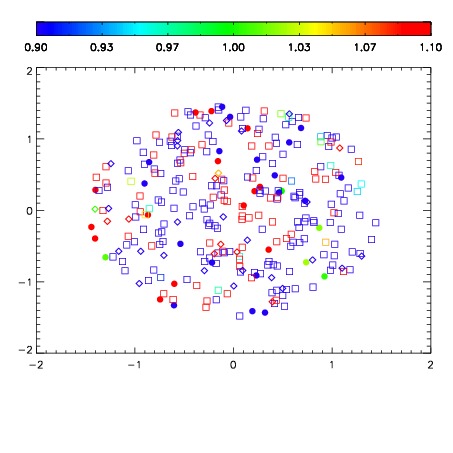
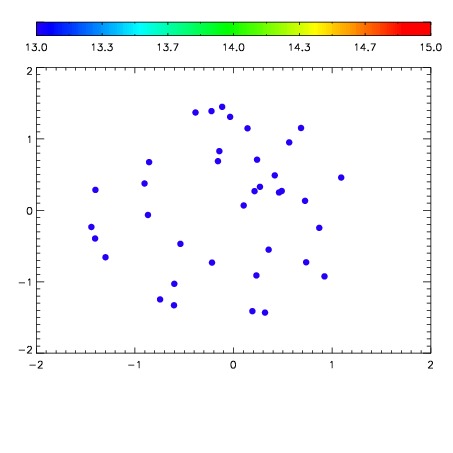

| Frame | Nreads | Zeropoints | Mag plots | Spatial mag deviation | Spatial sky 16325A emission deviations (filled: sky, open: star) | Spatial sky continuum emission | Spatial sky telluric CO2 absorption deviations (filled: H < 10) | |||||||||||||||||||||||
| 0 | 0 |
|
|
|
|
|
|
| IPAIR | NAME | SHIFT | NEWSHIFT | S/N | NAME | SHIFT | NEWSHIFT | S/N |
| 0 | 06380042 | 0.460132 | 0.00000 | 196.445 | 06380041 | 0.00000 | 0.460132 | 183.251 |
| 1 | 06380047 | 0.460008 | 0.000124007 | 214.446 | 06380048 | -0.0191427 | 0.479275 | 218.555 |
| 2 | 06380046 | 0.459536 | 0.000596017 | 213.947 | 06380045 | -0.00323541 | 0.463367 | 212.366 |
| 3 | 06380043 | 0.459994 | 0.000138015 | 200.354 | 06380044 | -0.0147471 | 0.474879 | 207.718 |