| Red | Green | Blue | |
| z | 17.64 | ||
| znorm | Inf | ||
| sky | -Inf | -Inf | -Inf |
| S/N | 27.9 | 46.1 | 53.3 |
| S/N(c) | 0.0 | 0.0 | 0.0 |
| SN(E/C) |
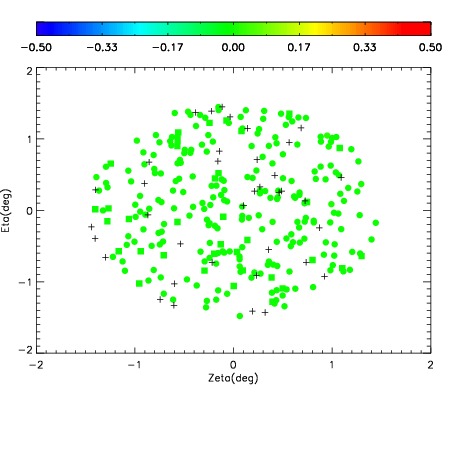
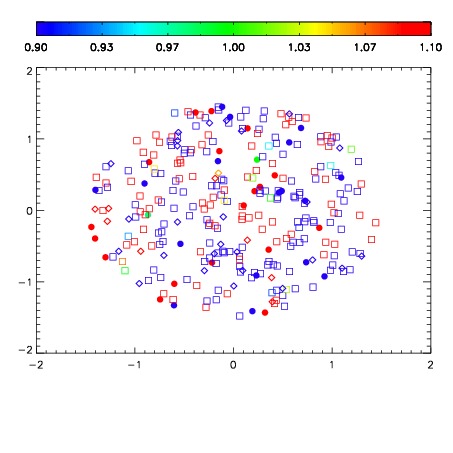
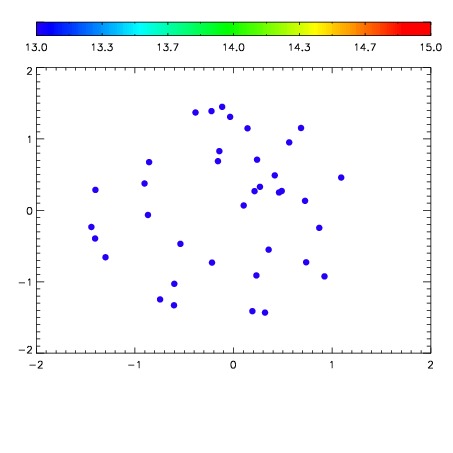

| Frame | Nreads | Zeropoints | Mag plots | Spatial mag deviation | Spatial sky 16325A emission deviations (filled: sky, open: star) | Spatial sky continuum emission | Spatial sky telluric CO2 absorption deviations (filled: H < 10) | |||||||||||||||||||||||
| 0 | 0 |
|
|
|
|
|
|
| IPAIR | NAME | SHIFT | NEWSHIFT | S/N | NAME | SHIFT | NEWSHIFT | S/N |
| 0 | 06610064 | 0.487629 | 0.00000 | 204.755 | 06610058 | 0.00000 | 0.487629 | 194.841 |
| 1 | 06610063 | 0.486856 | 0.000772983 | 204.157 | 06610062 | 0.00155830 | 0.486071 | 191.306 |
| 2 | 06610060 | 0.485481 | 0.00214800 | 196.713 | 06610065 | 0.00336679 | 0.484262 | 190.530 |
| 3 | 06610059 | 0.484530 | 0.00309899 | 190.960 | 06610061 | 0.00272826 | 0.484901 | 185.338 |