| Red | Green | Blue | |
| z | 17.64 | ||
| znorm | Inf | ||
| sky | -Inf | -Inf | -Inf |
| S/N | 23.8 | 41.8 | 44.8 |
| S/N(c) | 0.0 | 0.0 | 0.0 |
| SN(E/C) |
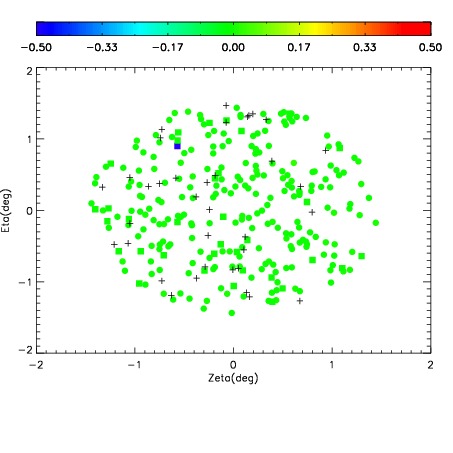
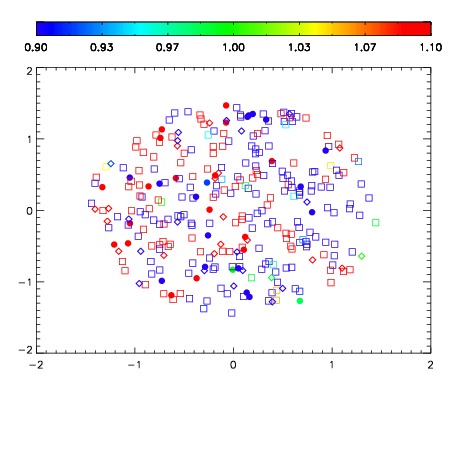
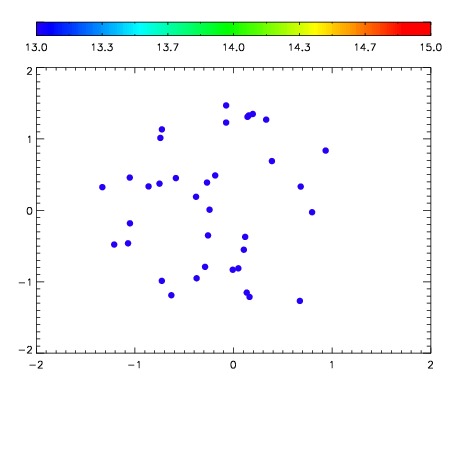

| Frame | Nreads | Zeropoints | Mag plots | Spatial mag deviation | Spatial sky 16325A emission deviations (filled: sky, open: star) | Spatial sky continuum emission | Spatial sky telluric CO2 absorption deviations (filled: H < 10) | |||||||||||||||||||||||
| 0 | 0 |
|
|
|
|
|
|
| IPAIR | NAME | SHIFT | NEWSHIFT | S/N | NAME | SHIFT | NEWSHIFT | S/N |
| 0 | 06340039 | 0.464826 | 0.00000 | 98.5786 | 06340040 | 0.00224942 | 0.462577 | 134.285 |
| 1 | 06340043 | 0.462654 | 0.00217199 | 222.718 | 06340044 | -0.00209077 | 0.466917 | 222.871 |
| 2 | 06340042 | 0.461880 | 0.00294599 | 220.617 | 06340037 | 0.00000 | 0.464826 | 201.847 |
| 3 | 06340038 | 0.463695 | 0.00113100 | 211.310 | 06340041 | 0.00126831 | 0.463558 | 183.118 |