| Red | Green | Blue | |
| z | 17.64 | ||
| znorm | Inf | ||
| sky | -Inf | -Inf | -Inf |
| S/N | 17.2 | 31.7 | 37.7 |
| S/N(c) | 0.0 | 0.0 | 0.0 |
| SN(E/C) |
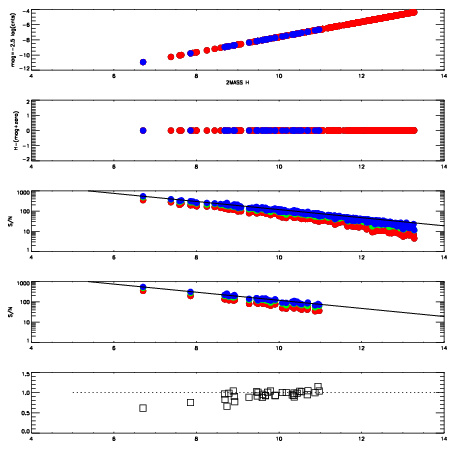
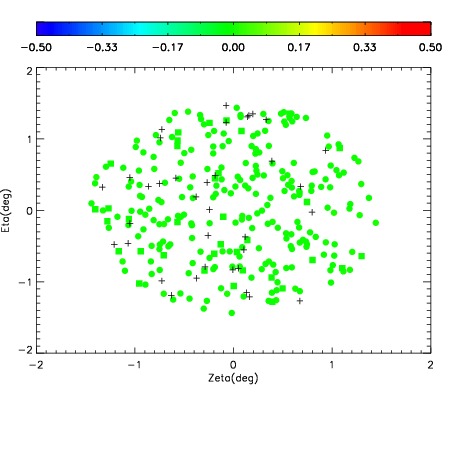
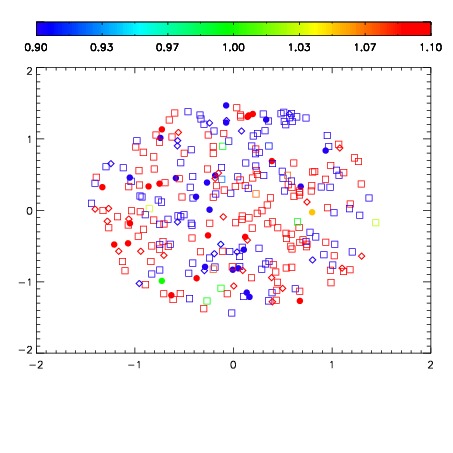
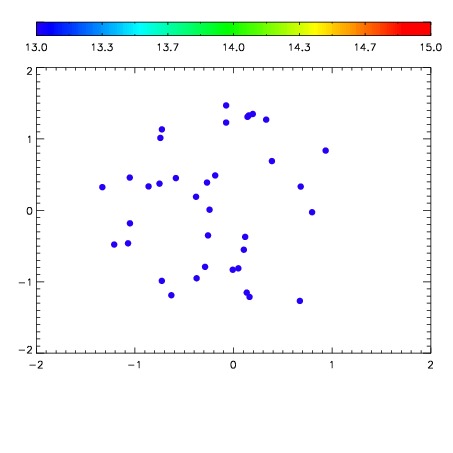

| Frame | Nreads | Zeropoints | Mag plots | Spatial mag deviation | Spatial sky 16325A emission deviations (filled: sky, open: star) | Spatial sky continuum emission | Spatial sky telluric CO2 absorption deviations (filled: H < 10) | |||||||||||||||||||||||
| 0 | 0 |
|
|
|
|
|
|
| IPAIR | NAME | SHIFT | NEWSHIFT | S/N | NAME | SHIFT | NEWSHIFT | S/N |
| 0 | 06400055 | 0.487233 | 0.00000 | 143.801 | 06400057 | -0.00171180 | 0.488945 | 146.641 |
| 1 | 06400058 | 0.486235 | 0.000998020 | 144.931 | 06400053 | 0.00000 | 0.487233 | 150.010 |
| 2 | 06400054 | 0.487081 | 0.000152022 | 140.862 | 06400060 | -4.02590e-05 | 0.487273 | 136.851 |
| 3 | 06400059 | 0.487123 | 0.000110000 | 133.461 | 06400056 | -0.000162996 | 0.487396 | 132.856 |