| Red | Green | Blue | |
| z | 17.64 | ||
| znorm | Inf | ||
| sky | -Inf | -Inf | -Inf |
| S/N | 24.8 | 43.8 | 49.7 |
| S/N(c) | 0.0 | 0.0 | 0.0 |
| SN(E/C) |

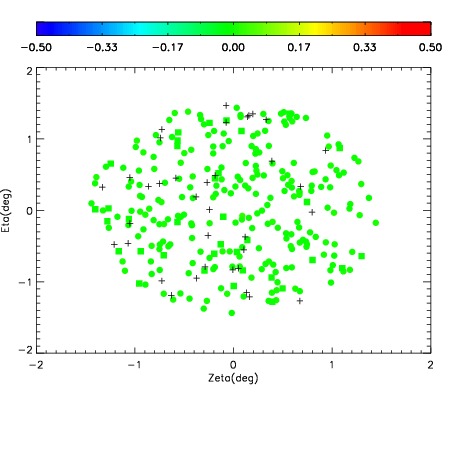
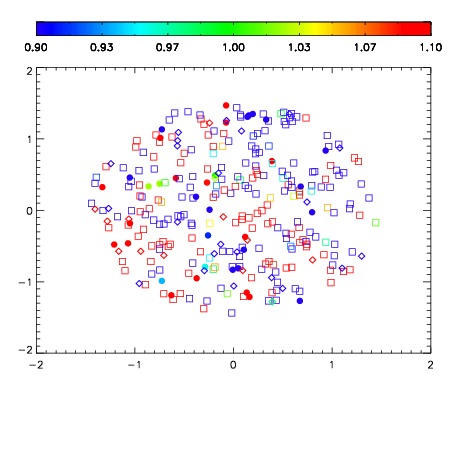
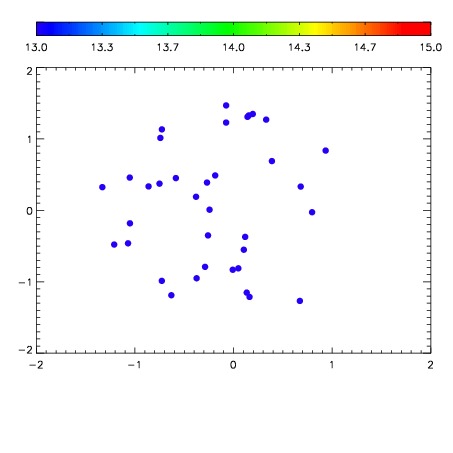

| Frame | Nreads | Zeropoints | Mag plots | Spatial mag deviation | Spatial sky 16325A emission deviations (filled: sky, open: star) | Spatial sky continuum emission | Spatial sky telluric CO2 absorption deviations (filled: H < 10) | |||||||||||||||||||||||
| 0 | 0 |
|
|
|
|
|
|
| IPAIR | NAME | SHIFT | NEWSHIFT | S/N | NAME | SHIFT | NEWSHIFT | S/N |
| 0 | 06620067 | 0.476859 | 0.00000 | 127.734 | 06620065 | 0.00424188 | 0.472617 | 162.464 |
| 1 | 06620060 | 0.474439 | 0.00242001 | 229.764 | 06620058 | -0.00448502 | 0.481344 | 216.329 |
| 2 | 06620059 | 0.474740 | 0.00211900 | 229.499 | 06620057 | -0.000669924 | 0.477529 | 211.555 |
| 3 | 06620063 | 0.475227 | 0.00163200 | 160.071 | 06620061 | -6.78806e-05 | 0.476927 | 195.346 |
| 4 | 06620064 | 0.475533 | 0.00132599 | 142.569 | 06620062 | -0.00304171 | 0.479901 | 188.898 |
| 5 | 06620056 | 0.475026 | 0.00183299 | 77.4870 | 06620066 | 0.00740613 | 0.469453 | 120.957 |
| 6 | 06620055 | 0.475924 | 0.000935018 | 42.1650 | 06620054 | 0.00000 | 0.476859 | 111.682 |