| Red | Green | Blue | |
| z | 17.64 | ||
| znorm | Inf | ||
| sky | -Inf | -Inf | -Inf |
| S/N | 12.6 | 24.4 | 31.8 |
| S/N(c) | 0.0 | 0.0 | 0.0 |
| SN(E/C) |
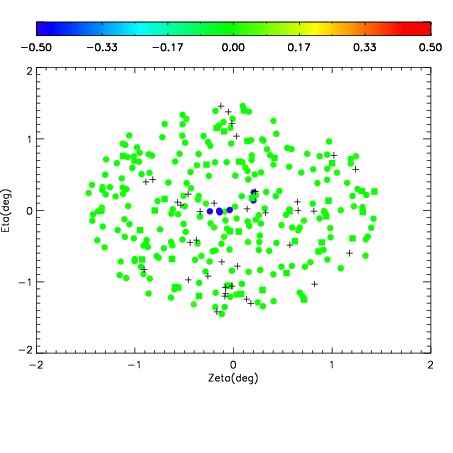
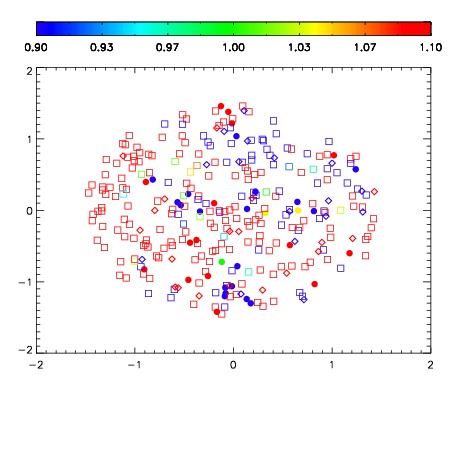
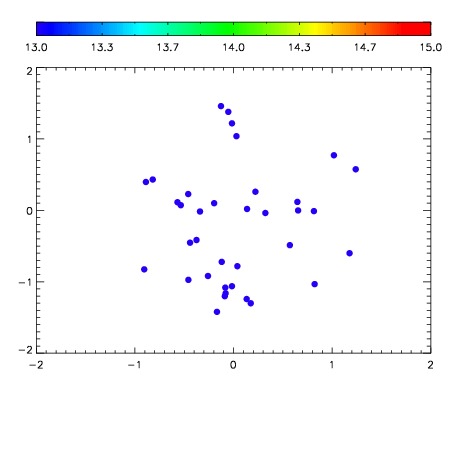

| Frame | Nreads | Zeropoints | Mag plots | Spatial mag deviation | Spatial sky 16325A emission deviations (filled: sky, open: star) | Spatial sky continuum emission | Spatial sky telluric CO2 absorption deviations (filled: H < 10) | |||||||||||||||||||||||
| 0 | 0 |
|
|
|
|
|
|
| IPAIR | NAME | SHIFT | NEWSHIFT | S/N | NAME | SHIFT | NEWSHIFT | S/N |
| 0 | 07200039 | 0.471987 | 0.00000 | 136.889 | 07200037 | 0.00000 | 0.471987 | 129.141 |
| 1 | 07200038 | 0.471492 | 0.000495017 | 117.453 | 07200044 | 0.00282074 | 0.469166 | 127.237 |
| 2 | 07200042 | 0.470460 | 0.00152701 | 114.089 | 07200041 | -0.00162353 | 0.473611 | 125.065 |
| 3 | 07200043 | 0.471148 | 0.000838995 | 86.7346 | 07200040 | 0.00186047 | 0.470127 | 104.302 |