| Red | Green | Blue | |
| z | 17.64 | ||
| znorm | Inf | ||
| sky | -Inf | -NaN | -Inf |
| S/N | 16.5 | 29.5 | 31.8 |
| S/N(c) | 0.0 | 0.0 | 0.0 |
| SN(E/C) |
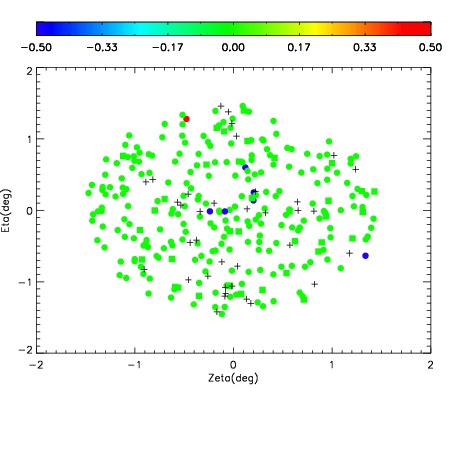
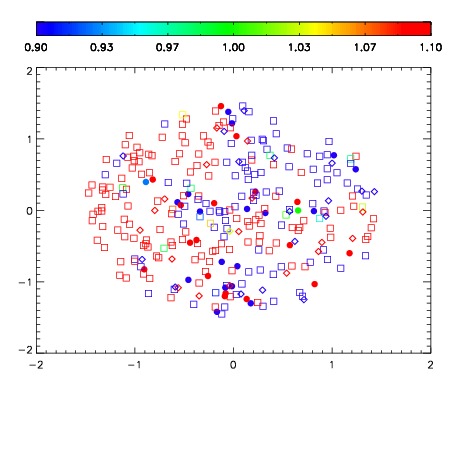
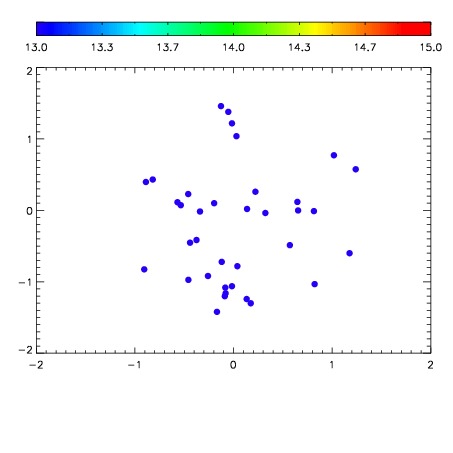

| Frame | Nreads | Zeropoints | Mag plots | Spatial mag deviation | Spatial sky 16325A emission deviations (filled: sky, open: star) | Spatial sky continuum emission | Spatial sky telluric CO2 absorption deviations (filled: H < 10) | |||||||||||||||||||||||
| 0 | 0 |
|
|
|
|
|
|
| IPAIR | NAME | SHIFT | NEWSHIFT | S/N | NAME | SHIFT | NEWSHIFT | S/N |
| 0 | 07560017 | 0.495611 | 0.00000 | 87.9979 | 07560015 | 0.00314634 | 0.492465 | 91.8515 |
| 1 | 07560012 | 0.491723 | 0.00388801 | 166.245 | 07560011 | 0.00000 | 0.495611 | 173.148 |
| 2 | 07560013 | 0.493486 | 0.00212502 | 157.563 | 07560014 | 0.00420579 | 0.491405 | 125.959 |
| 3 | 07560016 | 0.494032 | 0.00157902 | 123.155 | 07560018 | 0.00826944 | 0.487342 | 110.371 |