| Red | Green | Blue | |
| z | 17.64 | ||
| znorm | Inf | ||
| sky | -Inf | -Inf | -Inf |
| S/N | 24.7 | 40.5 | 48.9 |
| S/N(c) | 0.0 | 0.0 | 0.0 |
| SN(E/C) |

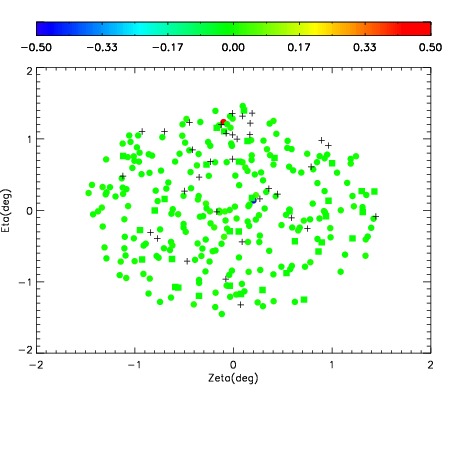
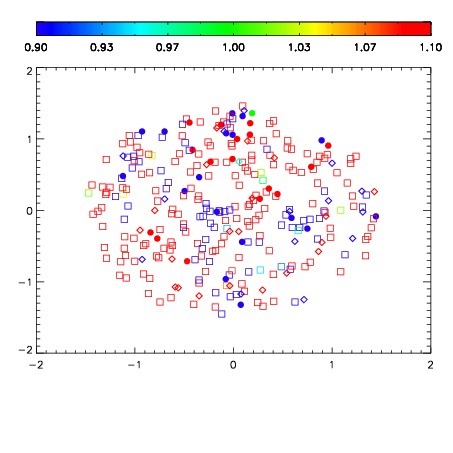
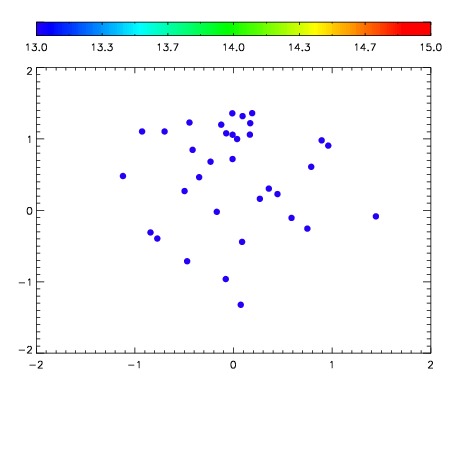

| Frame | Nreads | Zeropoints | Mag plots | Spatial mag deviation | Spatial sky 16325A emission deviations (filled: sky, open: star) | Spatial sky continuum emission | Spatial sky telluric CO2 absorption deviations (filled: H < 10) | |||||||||||||||||||||||
| 0 | 0 |
|
|
|
|
|
|
| IPAIR | NAME | SHIFT | NEWSHIFT | S/N | NAME | SHIFT | NEWSHIFT | S/N |
| 0 | 07020028 | 0.480641 | 0.00000 | 176.594 | 07020026 | 0.00000 | 0.480641 | 178.613 |
| 1 | 07020031 | 0.476469 | 0.00417200 | 185.680 | 07020030 | 0.000477173 | 0.480164 | 185.075 |
| 2 | 07020032 | 0.476990 | 0.00365099 | 185.230 | 07020029 | 0.00245235 | 0.478189 | 183.959 |
| 3 | 07020027 | 0.479712 | 0.000928998 | 181.675 | 07020033 | 0.00414705 | 0.476494 | 183.318 |