| Red | Green | Blue | |
| z | 17.64 | ||
| znorm | Inf | ||
| sky | -Inf | -Inf | -Inf |
| S/N | 27.4 | 44.7 | 51.1 |
| S/N(c) | 0.0 | 0.0 | 0.0 |
| SN(E/C) |
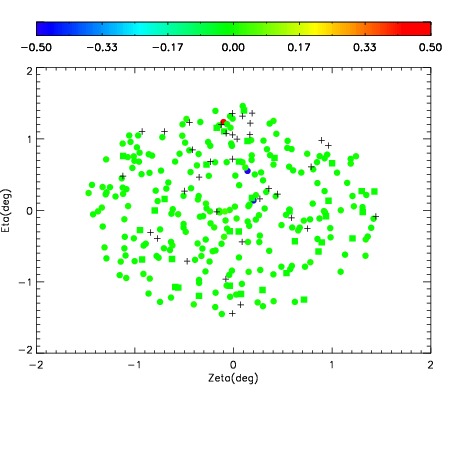
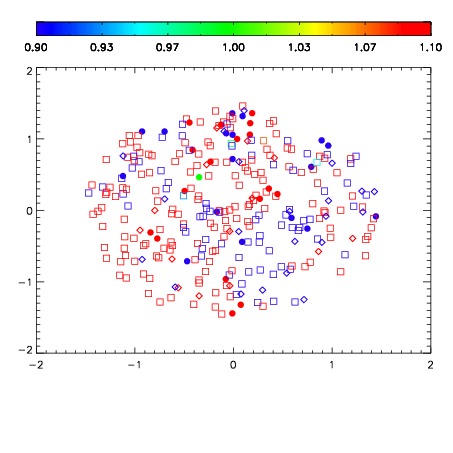
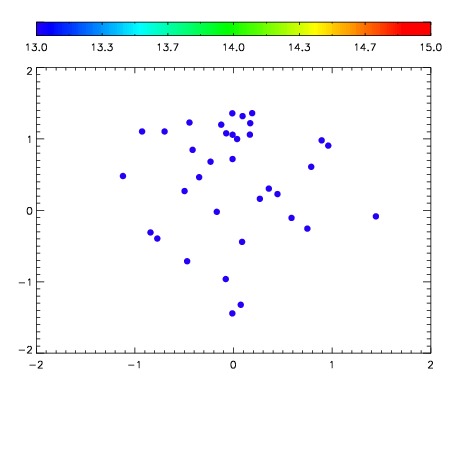

| Frame | Nreads | Zeropoints | Mag plots | Spatial mag deviation | Spatial sky 16325A emission deviations (filled: sky, open: star) | Spatial sky continuum emission | Spatial sky telluric CO2 absorption deviations (filled: H < 10) | |||||||||||||||||||||||
| 0 | 0 |
|
|
|
|
|
|
| IPAIR | NAME | SHIFT | NEWSHIFT | S/N | NAME | SHIFT | NEWSHIFT | S/N |
| 0 | 07210038 | 0.481382 | 0.00000 | 182.132 | 07210040 | -0.000505813 | 0.481888 | 184.350 |
| 1 | 07210039 | 0.481006 | 0.000376016 | 181.849 | 07210037 | 0.00000 | 0.481382 | 175.393 |
| 2 | 07210042 | 0.478269 | 0.00311300 | 172.157 | 07210041 | -0.00168960 | 0.483072 | 168.544 |
| 3 | 07210043 | 0.479341 | 0.00204101 | 171.669 | 07210044 | -0.000670753 | 0.482053 | 167.124 |