| Red | Green | Blue | |
| z | 17.64 | ||
| znorm | Inf | ||
| sky | -Inf | -Inf | -Inf |
| S/N | 31.2 | 53.1 | 57.2 |
| S/N(c) | 0.0 | 0.0 | 0.0 |
| SN(E/C) |
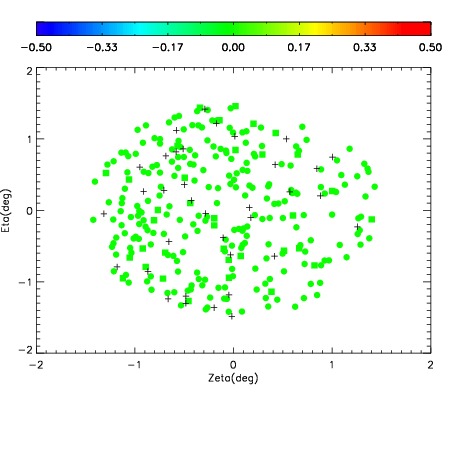
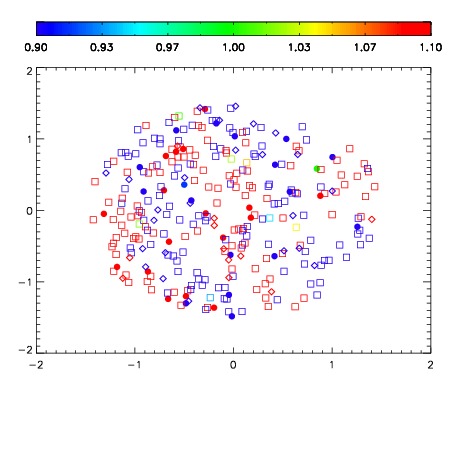
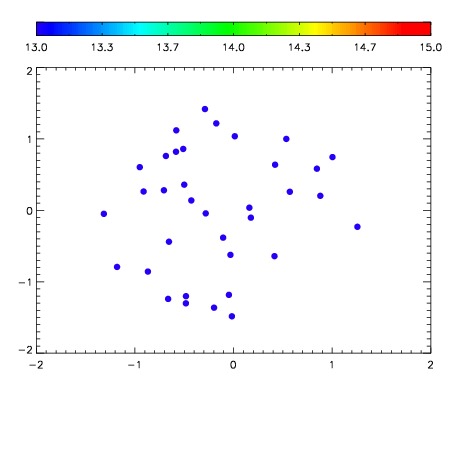

| Frame | Nreads | Zeropoints | Mag plots | Spatial mag deviation | Spatial sky 16325A emission deviations (filled: sky, open: star) | Spatial sky continuum emission | Spatial sky telluric CO2 absorption deviations (filled: H < 10) | |||||||||||||||||||||||
| 0 | 0 |
|
|
|
|
|
|
| IPAIR | NAME | SHIFT | NEWSHIFT | S/N | NAME | SHIFT | NEWSHIFT | S/N |
| 0 | 06430027 | 0.487649 | 0.00000 | 210.424 | 06430028 | 0.000708246 | 0.486941 | 211.596 |
| 1 | 06430026 | 0.487330 | 0.000319004 | 211.702 | 06430025 | -0.000954473 | 0.488603 | 212.957 |
| 2 | 06430022 | 0.483846 | 0.00380298 | 211.210 | 06430024 | -0.000201666 | 0.487851 | 212.159 |
| 3 | 06430023 | 0.483953 | 0.00369599 | 210.004 | 06430021 | 0.00000 | 0.487649 | 207.172 |