| Red | Green | Blue | |
| z | 17.64 | ||
| znorm | Inf | ||
| sky | -Inf | -Inf | -Inf |
| S/N | 33.6 | 57.3 | 63.9 |
| S/N(c) | 0.0 | 0.0 | 0.0 |
| SN(E/C) |

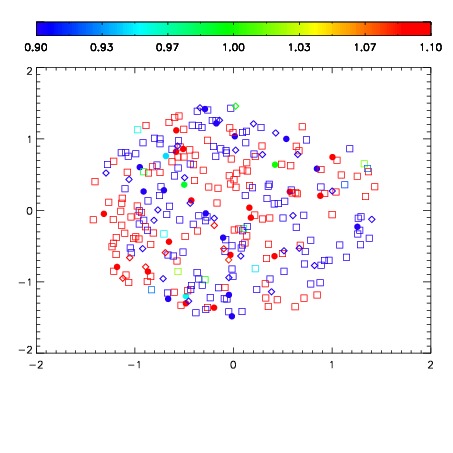
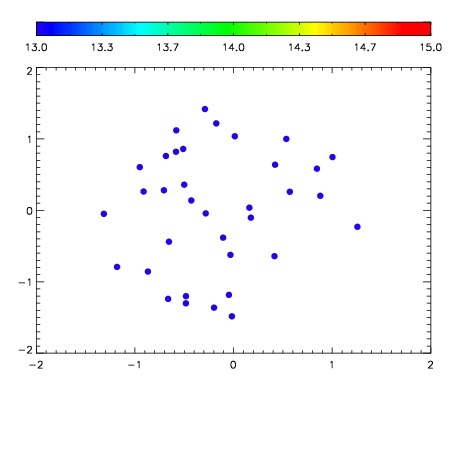

| Frame | Nreads | Zeropoints | Mag plots | Spatial mag deviation | Spatial sky 16325A emission deviations (filled: sky, open: star) | Spatial sky continuum emission | Spatial sky telluric CO2 absorption deviations (filled: H < 10) | |||||||||||||||||||||||
| 0 | 0 |
|
|
|
|
|
|
| IPAIR | NAME | SHIFT | NEWSHIFT | S/N | NAME | SHIFT | NEWSHIFT | S/N |
| 0 | 06590038 | 0.467065 | 0.00000 | 195.281 | 06590039 | -0.00330007 | 0.470365 | 191.021 |
| 1 | 06590042 | 0.465482 | 0.00158301 | 197.028 | 06590040 | 0.000607361 | 0.466458 | 197.347 |
| 2 | 06590037 | 0.466196 | 0.000869006 | 196.935 | 06590047 | -0.00354389 | 0.470609 | 196.770 |
| 3 | 06590041 | 0.464611 | 0.00245401 | 196.327 | 06590043 | 0.00586041 | 0.461205 | 196.354 |
| 4 | 06590046 | 0.464343 | 0.00272200 | 193.522 | 06590036 | 0.00000 | 0.467065 | 188.556 |
| 5 | 06590045 | 0.464729 | 0.00233600 | 184.442 | 06590044 | 0.00374141 | 0.463324 | 173.887 |