| Red | Green | Blue | |
| z | 17.64 | ||
| znorm | Inf | ||
| sky | -Inf | -Inf | -Inf |
| S/N | 27.5 | 48.0 | 51.7 |
| S/N(c) | 0.0 | 0.0 | 0.0 |
| SN(E/C) |
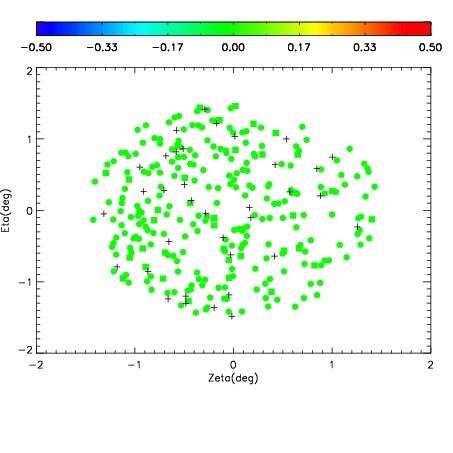
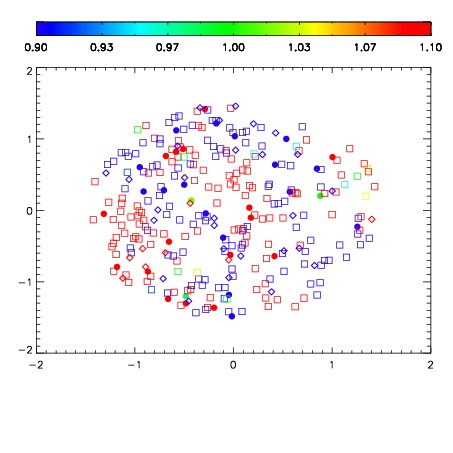
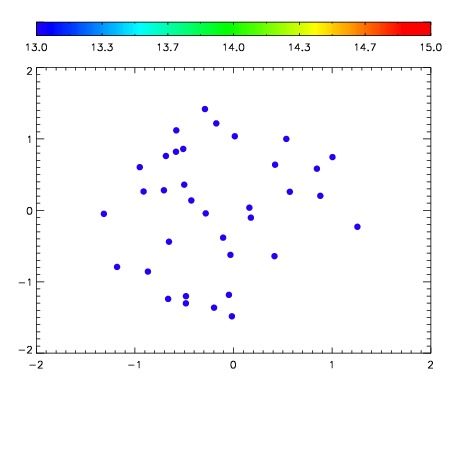

| Frame | Nreads | Zeropoints | Mag plots | Spatial mag deviation | Spatial sky 16325A emission deviations (filled: sky, open: star) | Spatial sky continuum emission | Spatial sky telluric CO2 absorption deviations (filled: H < 10) | |||||||||||||||||||||||
| 0 | 0 |
|
|
|
|
|
|
| IPAIR | NAME | SHIFT | NEWSHIFT | S/N | NAME | SHIFT | NEWSHIFT | S/N |
| 0 | 06690031 | 0.485027 | 0.00000 | 191.927 | 06690036 | -0.00360262 | 0.488630 | 192.276 |
| 1 | 06690030 | 0.484452 | 0.000574976 | 197.327 | 06690033 | -0.00287689 | 0.487904 | 193.223 |
| 2 | 06690035 | 0.483159 | 0.00186798 | 192.284 | 06690029 | 0.00000 | 0.485027 | 192.554 |
| 3 | 06690034 | 0.482778 | 0.00224897 | 191.353 | 06690032 | -0.00366972 | 0.488697 | 190.118 |