| Red | Green | Blue | |
| z | 17.64 | ||
| znorm | Inf | ||
| sky | -Inf | -Inf | -Inf |
| S/N | 28.7 | 47.7 | 52.5 |
| S/N(c) | 0.0 | 0.0 | 0.0 |
| SN(E/C) |
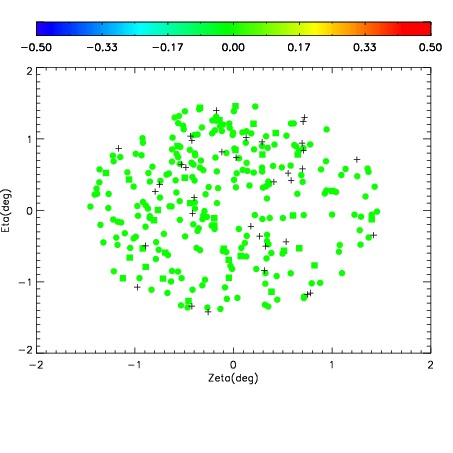

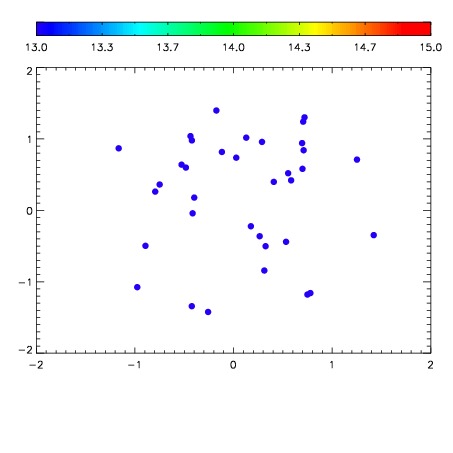

| Frame | Nreads | Zeropoints | Mag plots | Spatial mag deviation | Spatial sky 16325A emission deviations (filled: sky, open: star) | Spatial sky continuum emission | Spatial sky telluric CO2 absorption deviations (filled: H < 10) | |||||||||||||||||||||||
| 0 | 0 |
|
|
|
|
|
|
| IPAIR | NAME | SHIFT | NEWSHIFT | S/N | NAME | SHIFT | NEWSHIFT | S/N |
| 0 | 06440013 | 0.470695 | 0.00000 | 205.883 | 06440011 | 0.00000 | 0.470695 | 206.568 |
| 1 | 06440012 | 0.470430 | 0.000265002 | 205.526 | 06440018 | -0.00770873 | 0.478404 | 205.843 |
| 2 | 06440017 | 0.469786 | 0.000909001 | 203.826 | 06440014 | -0.00708307 | 0.477778 | 205.292 |
| 3 | 06440016 | 0.469318 | 0.00137699 | 202.036 | 06440015 | -0.00593272 | 0.476628 | 204.270 |