| Red | Green | Blue | |
| z | 17.64 | ||
| znorm | Inf | ||
| sky | -Inf | -Inf | -Inf |
| S/N | 28.6 | 48.9 | 54.6 |
| S/N(c) | 0.0 | 0.0 | 0.0 |
| SN(E/C) |
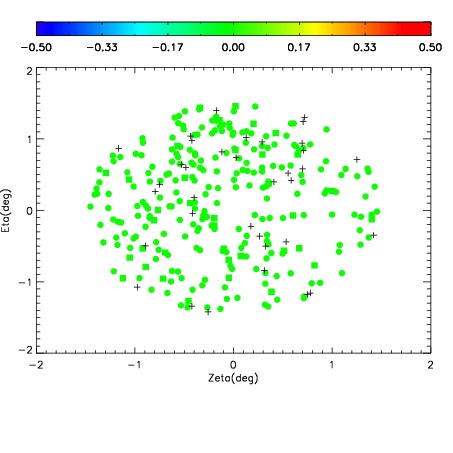
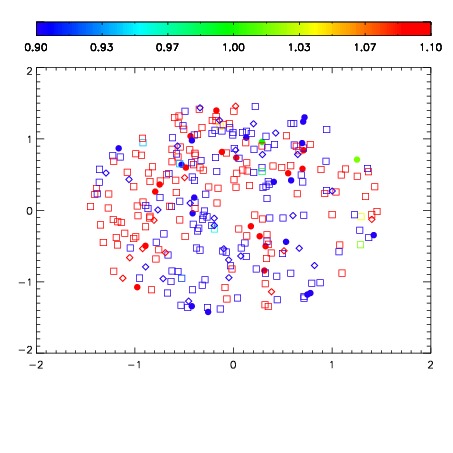


| Frame | Nreads | Zeropoints | Mag plots | Spatial mag deviation | Spatial sky 16325A emission deviations (filled: sky, open: star) | Spatial sky continuum emission | Spatial sky telluric CO2 absorption deviations (filled: H < 10) | |||||||||||||||||||||||
| 0 | 0 |
|
|
|
|
|
|
| IPAIR | NAME | SHIFT | NEWSHIFT | S/N | NAME | SHIFT | NEWSHIFT | S/N |
| 0 | 06610042 | 0.484812 | 0.00000 | 209.821 | 06610043 | 0.00171725 | 0.483095 | 204.019 |
| 1 | 06610038 | 0.484280 | 0.000532001 | 215.950 | 06610040 | -0.000741071 | 0.485553 | 216.994 |
| 2 | 06610037 | 0.483485 | 0.00132698 | 215.292 | 06610036 | 0.00000 | 0.484812 | 215.323 |
| 3 | 06610041 | 0.483679 | 0.00113299 | 213.960 | 06610039 | 0.00316812 | 0.481644 | 214.895 |