| Red | Green | Blue | |
| z | 17.64 | ||
| znorm | Inf | ||
| sky | -Inf | -Inf | -Inf |
| S/N | 24.8 | 41.4 | 46.2 |
| S/N(c) | 0.0 | 0.0 | 0.0 |
| SN(E/C) |

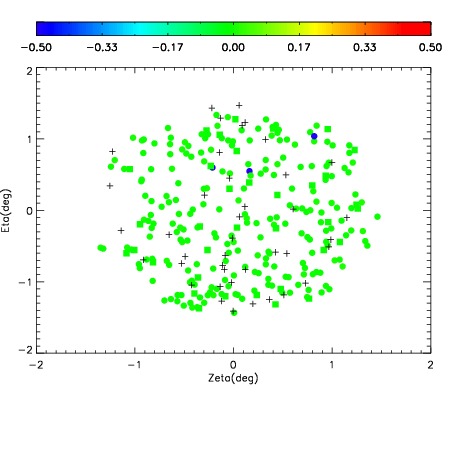
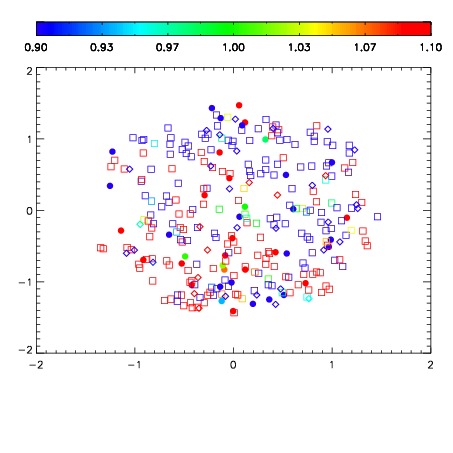
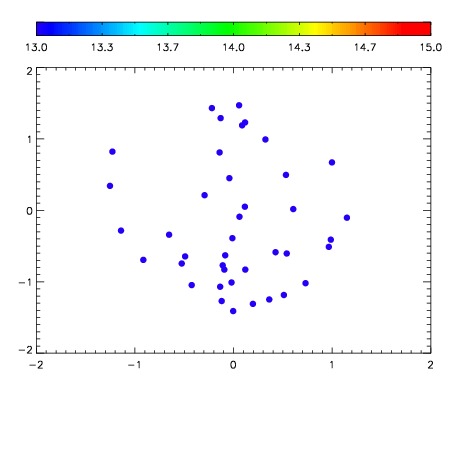

| Frame | Nreads | Zeropoints | Mag plots | Spatial mag deviation | Spatial sky 16325A emission deviations (filled: sky, open: star) | Spatial sky continuum emission | Spatial sky telluric CO2 absorption deviations (filled: H < 10) | |||||||||||||||||||||||
| 0 | 0 |
|
|
|
|
|
|
| IPAIR | NAME | SHIFT | NEWSHIFT | S/N | NAME | SHIFT | NEWSHIFT | S/N |
| 0 | 06660053 | 0.487020 | 0.00000 | 219.819 | 06660054 | 0.000660171 | 0.486360 | 214.140 |
| 1 | 06660049 | 0.485736 | 0.00128397 | 228.007 | 06660050 | 9.19710e-05 | 0.486928 | 225.989 |
| 2 | 06660052 | 0.486769 | 0.000250995 | 226.642 | 06660047 | 0.00000 | 0.487020 | 224.694 |
| 3 | 06660048 | 0.486161 | 0.000858992 | 222.164 | 06660051 | -0.000696799 | 0.487717 | 220.327 |