| Red | Green | Blue | |
| z | 17.64 | ||
| znorm | Inf | ||
| sky | -Inf | -Inf | -Inf |
| S/N | 26.4 | 45.6 | 51.2 |
| S/N(c) | 0.0 | 0.0 | 0.0 |
| SN(E/C) |
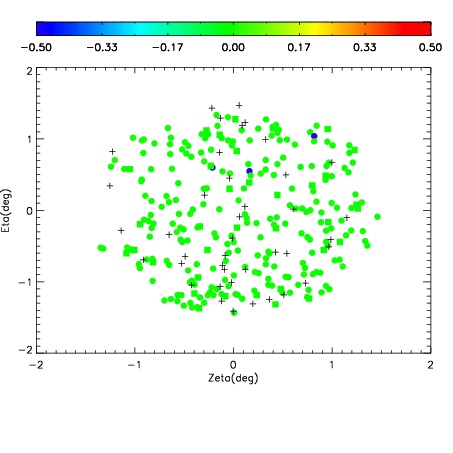
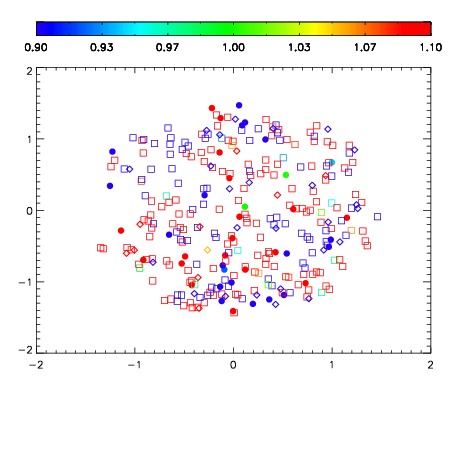
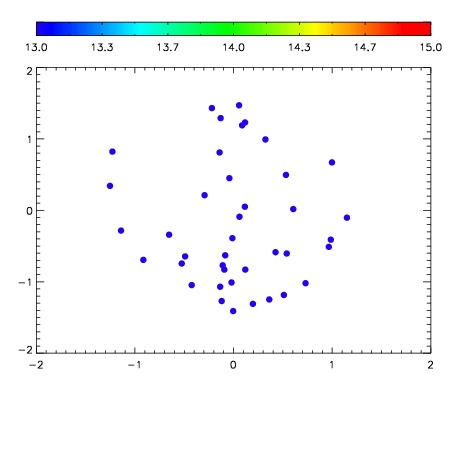

| Frame | Nreads | Zeropoints | Mag plots | Spatial mag deviation | Spatial sky 16325A emission deviations (filled: sky, open: star) | Spatial sky continuum emission | Spatial sky telluric CO2 absorption deviations (filled: H < 10) | |||||||||||||||||||||||
| 0 | 0 |
|
|
|
|
|
|
| IPAIR | NAME | SHIFT | NEWSHIFT | S/N | NAME | SHIFT | NEWSHIFT | S/N |
| 0 | 06700047 | 0.487552 | 0.00000 | 222.756 | 06700048 | 0.00449622 | 0.483056 | 223.497 |
| 1 | 06700042 | 0.485769 | 0.00178298 | 227.929 | 06700041 | 0.00000 | 0.487552 | 224.856 |
| 2 | 06700046 | 0.486808 | 0.000743985 | 224.749 | 06700044 | 0.00150987 | 0.486042 | 223.815 |
| 3 | 06700043 | 0.485439 | 0.00211298 | 218.977 | 06700045 | 0.00399953 | 0.483552 | 220.873 |