| Red | Green | Blue | |
| z | 17.64 | ||
| znorm | Inf | ||
| sky | -Inf | -Inf | -Inf |
| S/N | 31.1 | 50.1 | 58.7 |
| S/N(c) | 0.0 | 0.0 | 0.0 |
| SN(E/C) |
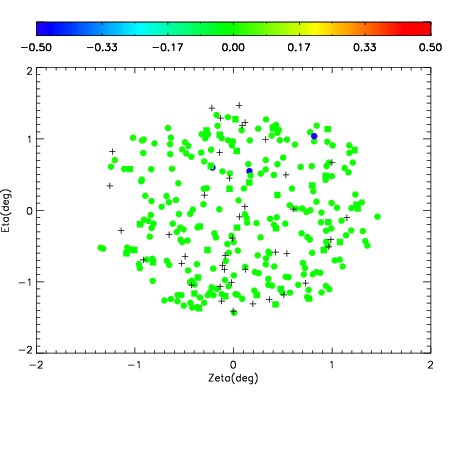
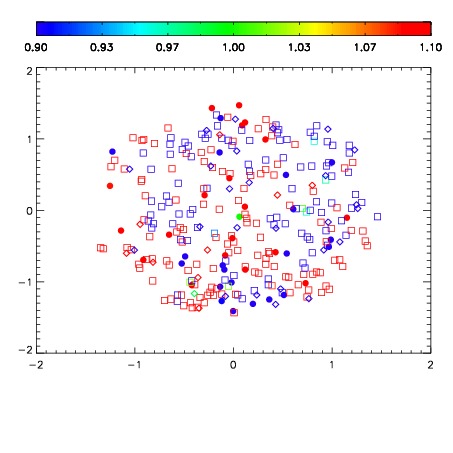
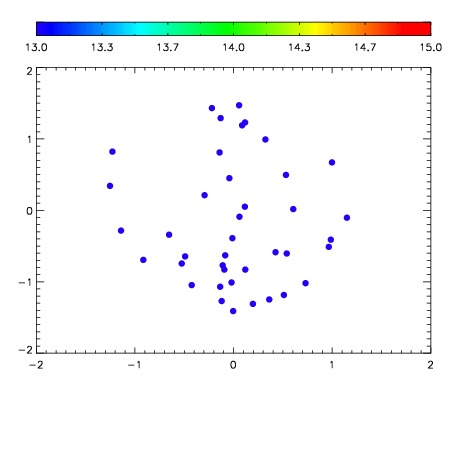

| Frame | Nreads | Zeropoints | Mag plots | Spatial mag deviation | Spatial sky 16325A emission deviations (filled: sky, open: star) | Spatial sky continuum emission | Spatial sky telluric CO2 absorption deviations (filled: H < 10) | |||||||||||||||||||||||
| 0 | 0 |
|
|
|
|
|
|
| IPAIR | NAME | SHIFT | NEWSHIFT | S/N | NAME | SHIFT | NEWSHIFT | S/N |
| 0 | 06930044 | 0.499507 | 0.00000 | 216.694 | 06930042 | 0.00165324 | 0.497854 | 217.816 |
| 1 | 06930040 | 0.498846 | 0.000661016 | 220.426 | 06930038 | 0.00000 | 0.499507 | 225.822 |
| 2 | 06930039 | 0.498255 | 0.00125200 | 216.577 | 06930045 | 0.00401725 | 0.495490 | 216.499 |
| 3 | 06930043 | 0.499301 | 0.000206023 | 216.015 | 06930046 | 0.00165727 | 0.497850 | 212.552 |
| 4 | 06930047 | 0.499077 | 0.000430018 | 213.122 | 06930041 | 0.00643094 | 0.493076 | 212.046 |